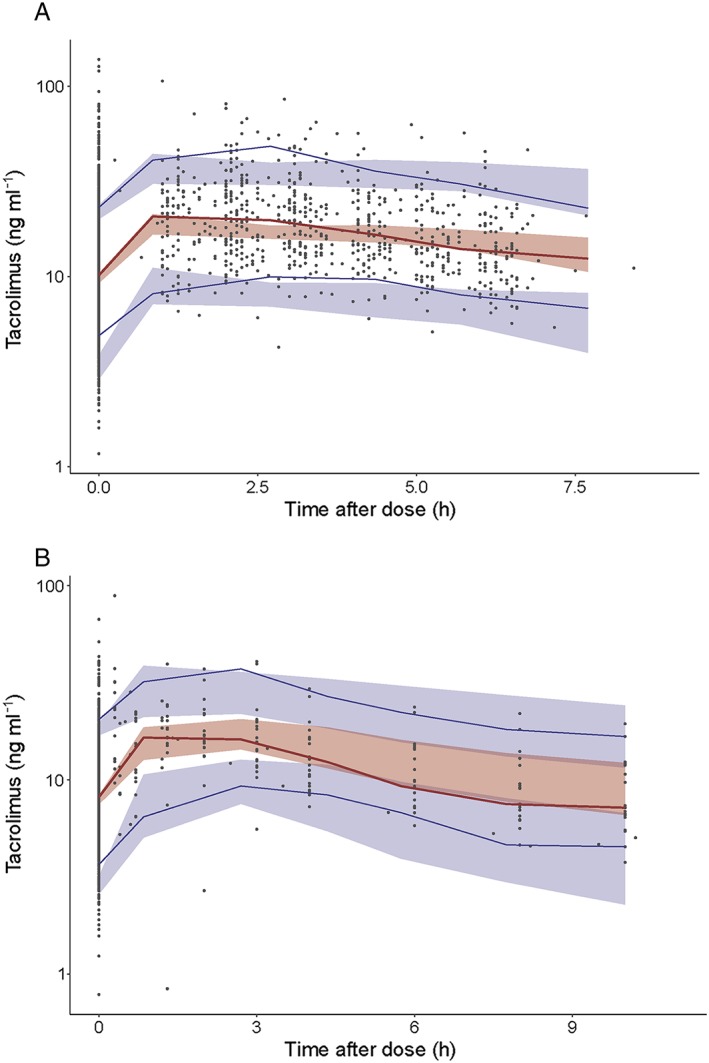
Figure 2.

Prediction‐corrected visual predictive check (VPC) showing how well the average trend of the observations (red line) and how well the variability of the observed data (blue lines) fall within the model simulated (n = 500) average trend (red shaded area) and the model simulated variability (blue shaded areas) represented as 95% confidence interval. The average and the variability of the observed data both fall within the corresponding simulations. (A) Prediction‐corrected VPC of the final model (internal dataset). (B) Prediction‐corrected VPC of the final model (external dataset)
