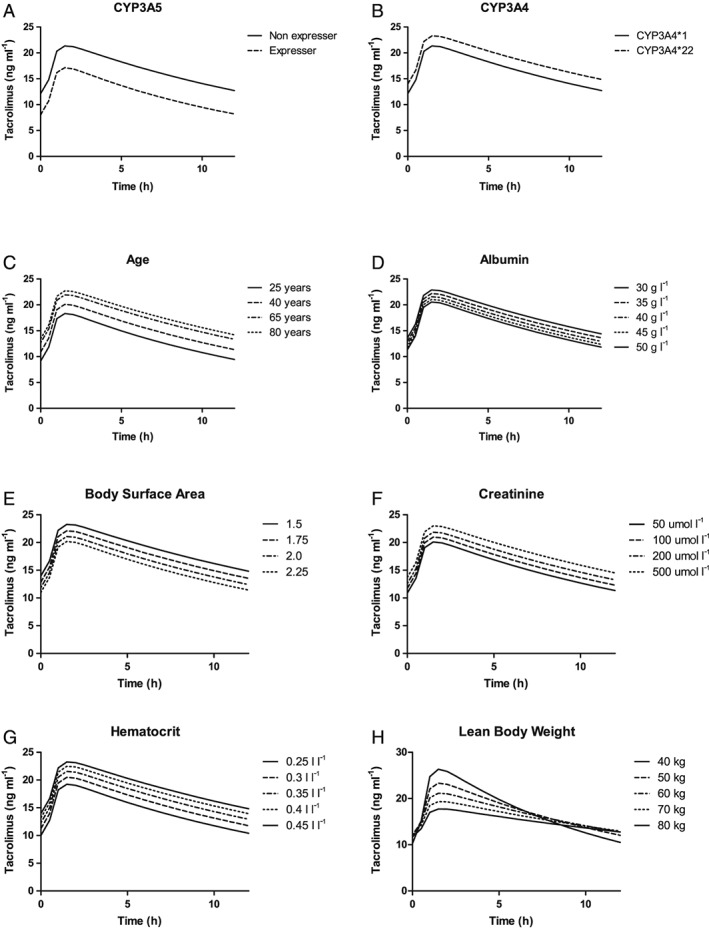
Figure 3.

Simulated plasma profiles of tacrolimus at first steady state after transplantation. (A) Simulated plasma profiles of tacrolimus for CYP3A5 nonexpressers (CYP3A5*3/*3) and CYP3A5 expressers (CYP3A5*1/*1 or CYP3A5*1/*3). (B) Simulated plasma profiles of tacrolimus for patients carrying the CYP3A4*1 allele and the CYP3A4*22 allele. (C) Simulated plasma profiles of tacrolimus for patients aged 25, 40, 65 and 80 years. (D) Simulated plasma profiles of tacrolimus for patients with albumin levels of 30, 35, 40, 45 and 50 g l–1. (E) Simulated plasma profiles of tacrolimus for patients with a BSA of 1.5, 1.75, 2 and 2.25 m2. (F) Simulated plasma profiles of tacrolimus for patients with creatinine concentrations of 50, 100, 200 and 500 μmol l–1. (G) Simulated plasma profiles of tacrolimus for patients with haematocrit levels of 0.25, 0.3, 0.35, 0.4 and 0.45 l l–1. (H) Simulated plasma profiles of tacrolimus for patients with an LBW of 40, 50, 60, 70 and 80 kg. BSA, body surface area; CYP, cytochrome P450; LBW, lean body weight
