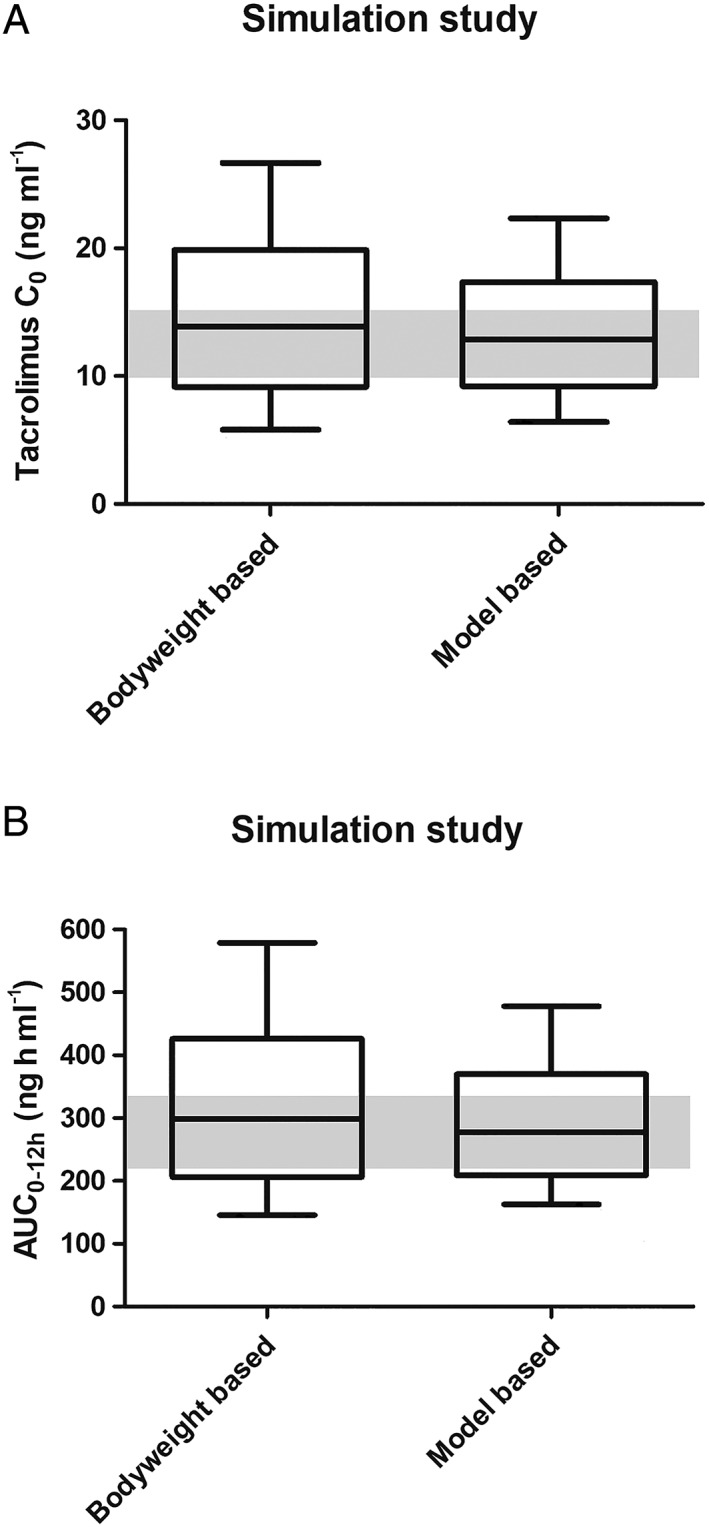
Figure 5.

Boxplot with 10–90 percentile whiskers comparing simulations of the standard bodyweight‐based dose and a dose based on the starting dose model. (A) Simulated predose concentrations. The median tacrolimus C0 in the bodyweight‐based dose group was 13.9 ng ml–1, and in the model‐based dose group 12.9 ng ml–1. (B) Simulated AUCs. The median tacrolimus AUC in the bodyweight‐based dose group was 298.5 ng h ml–1, and in the model‐based dose group 277.9 ng h ml–1. AUC, area under the curve
