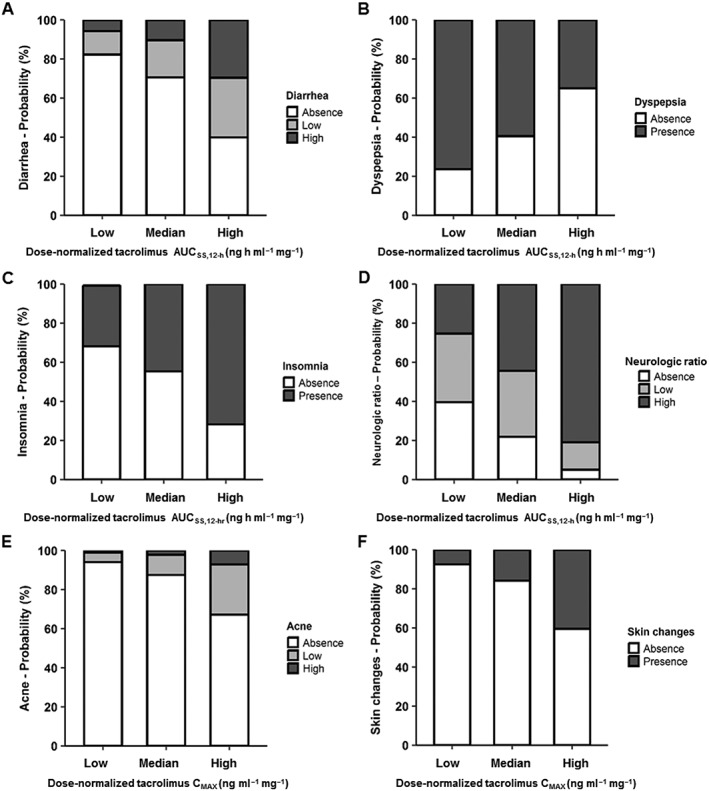
Figure 2.

Probabilities of the occurrence of adverse effects after tacrolimus administration in renal transplant recipients according to dose‐normalized tacrolimus exposure AUCss0–12h and maximum concentration (CMAX). Tacrolimus exposure is represented as the area under the concentration curve at steady‐state between 0 and 12 h (AUCss0–12h; A–D). The 5th, 50th, and 95th percentiles of the distribution of dose‐normalized tacrolimus exposure and maximum concentration obtained from the population pharmacokinetic model for all patients were used to calculate the probabilities of adverse effect occurrence. For dose‐normalized tacrolimus AUCss0–12h, the 5th, 50th and 95th percentiles were 18 (low), 42 (median), and 88 (high) ng h ml–1 mg–1. Note that at high dose‐normalized AUCss0–12h, the severity and/or frequency of the AE including diarrhoea, insomnia and neurological ratio are greater. For dose‐normalized tacrolimus CMAX, the 5th, 50th, and 95th percentiles were 2.4 (Low), 6.4 (Median) and 12.8 (High) ng ml–1 mg–1. The frequency or severity of AEs is greater at higher dose‐normalized CMAX (E, F)
