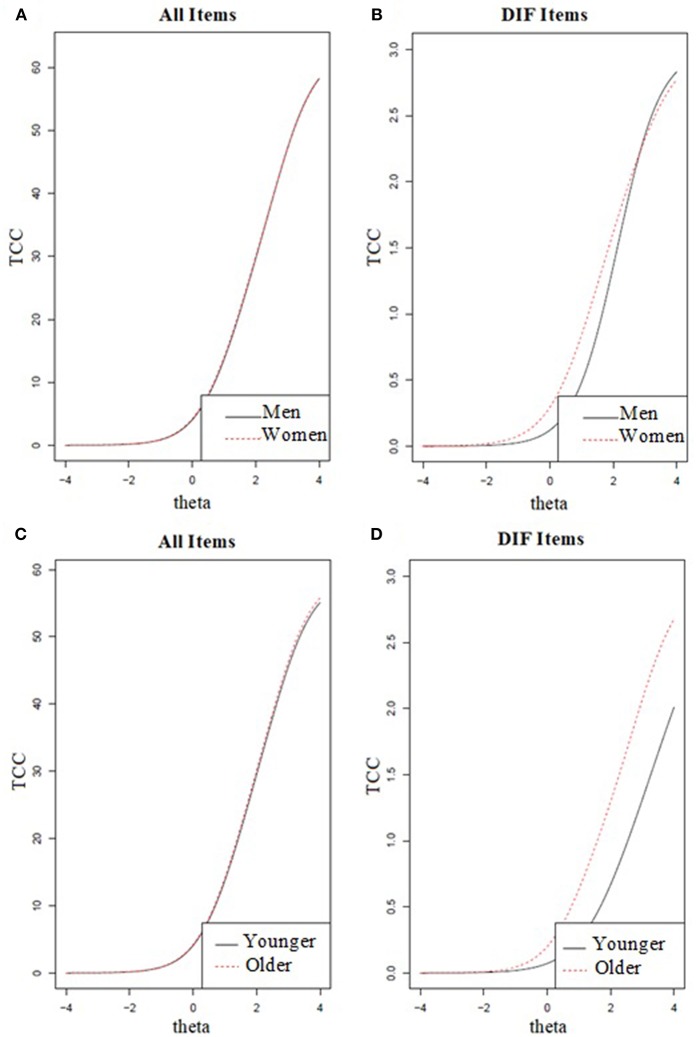
Figure 2.
Overall impact of differential item functioning (DIF) for gender and age on the test characteristic curves (TCC). The first (A) and third (C) plots display the TCC of all items and the second (B) and fourth (D) plots display the TCC of specific DIF items (i.e., item #10 for gender and item #21 for age).

