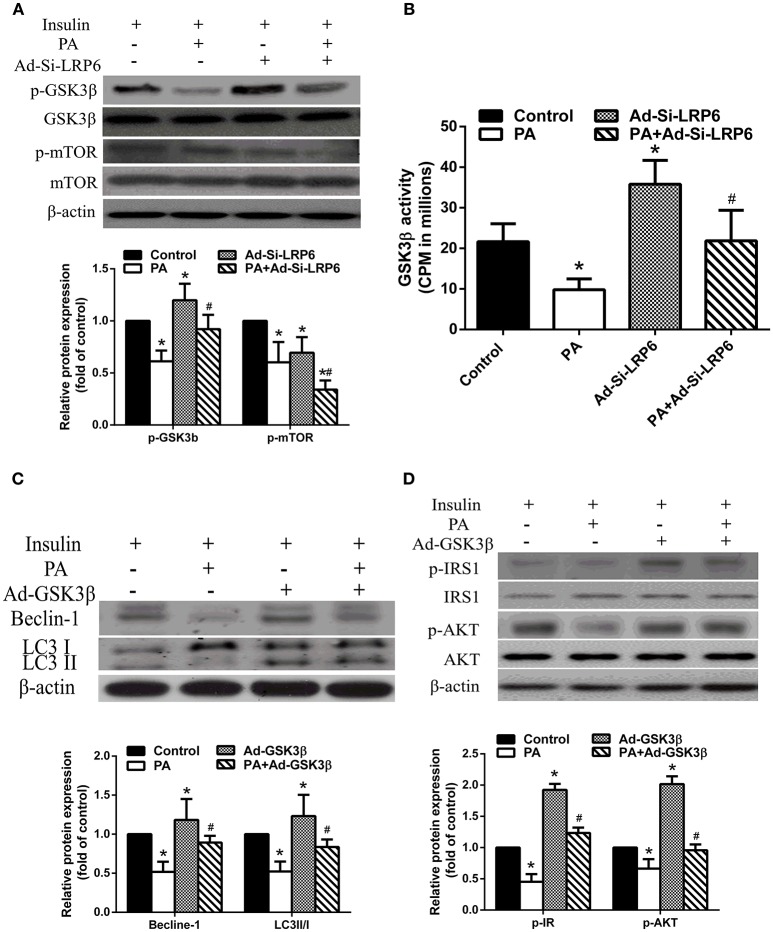
Figure 5.
GSK3β activation was involved in mediating the effects of LRP6 knock down on autophagy and insulin signaling. (A) LRP6 knock down inhibited mTOR in LO2 hepatocytes as shown by western blot analysis and quantifications of indicated proteins in the bar graph. *p < 0.05 vs. no-PA treatment group; #p < 0.05 vs. PA treatment group (n = 6). (B) LRP6 activated GSK3β independent of inhibitory phosphorylation. *p < 0.05 vs. no-PA treatment group; #p < 0.05 vs. PA treatment group (n = 6). (C) Overexpression of GSK3β activated autophagy in LO2 hepatocytes. Protein quantification was shown in the bar graph. *p < 0.05 vs. control group; #p < 0.05 vs. PA treatment group (n = 6). (D) Overexpression of GSK3β attenuated insulin signal pathway disruption induced by PA treatment as shown by western blot analysis and quantifications of indicated proteins in the bar graph. *p < 0.05 vs. control group; #p < 0.05 vs. PA treatment group (n = 6).

