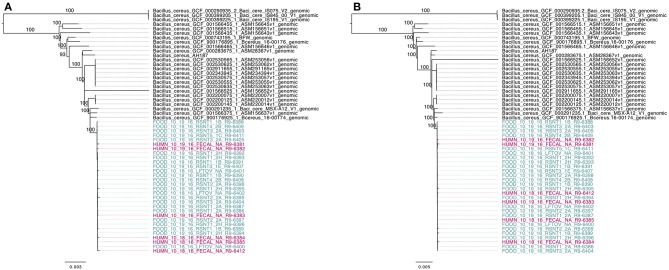
Figure 8.
Maximum likelihood phylogenies of 30 emetic group III isolates (ST 26) sequenced in conjunction with a B. cereus outbreak, as well as all other emetic group III ST 26 genomes available in NCBI (n = 25; shown in black). Trees were constructed using core SNPs identified using (A) kSNP3 or (B) Parsnp. Tip labels in maroon and teal correspond to the six human clinical isolates and 24 isolates from food sequenced in conjunction with this outbreak, respectively. Branch labels correspond to bootstrap support percentages out of 1,000 replicates. Due to the short lengths and low bootstrap support of branches within the outbreak clade, bootstrap support percentages are not shown on branches within the outbreak clade.

