
Figure 2.
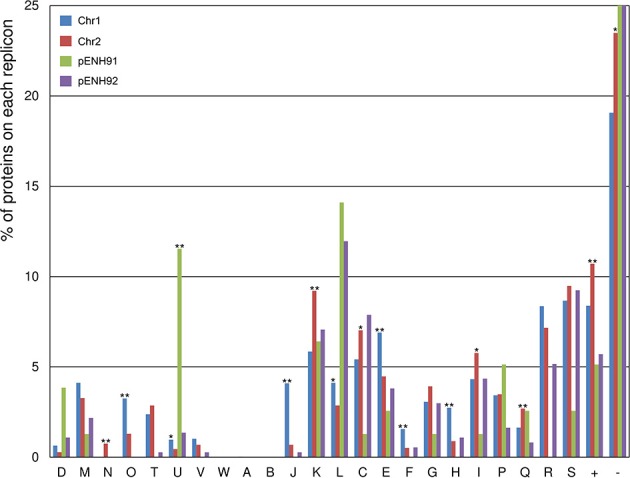
Functional classification of proteins encoded on each replicon of the NH9 genome based on Clusters of Orthologous Groups (COG) categories. COG categories are shown on the horizontal axis, with the percentage of proteins belonging to each category for each replicon plotted on the vertical axis (percentages >25% are not shown). *p < 0.05 and **p < 0.01, respectively, as determined by Fisher's test with false discovery rate adjustments. COG functional annotations and specific values are summarized in Table S1.