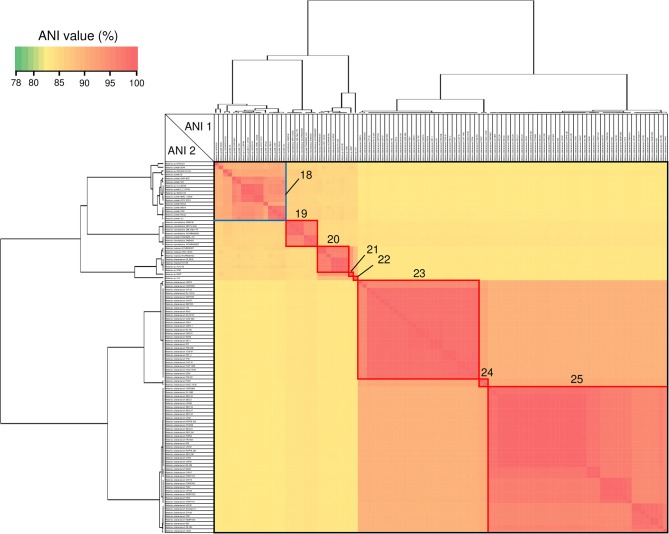
Figure 7.
Heatmap and dendrogram of average nucleotide identity (ANI) values of the 101 putative Ralstonia genomes. Strains with ANI values >90 and >95% are shown within blue and red squares, respectively (see Table 3 and Table S4 for a description of cluster designations). All squares were assigned a number from 18 to 25.

