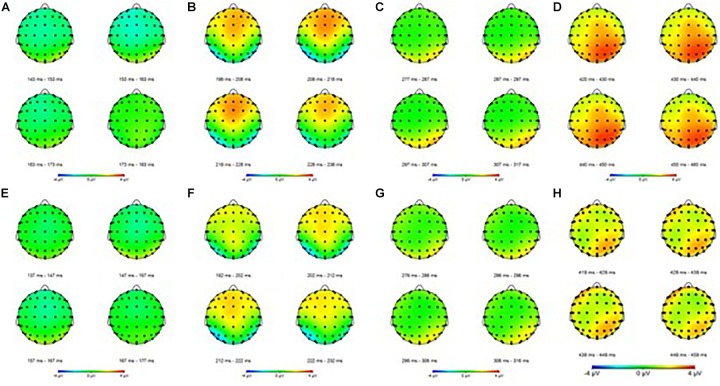
FIGURE 4.
Event-related potential mapping of correct and error trials. (A–D) Show the N1, P2, N2, and P3 mapping of correct ERP, respectively; (E–G) show the N1, P2, N2, and P3 mapping of error ERP, respectively. (A,E) Show the N1 amplitudes of the two trials; (B,F) show that the P2 amplitudes of the error trials was smaller than that of the correct trials in central areas; (C,G) show the N2 amplitudes of the two trials; (D,H) show that the P3 amplitudes of the error trials was smaller than that of the correct trials in the parietal areas.

