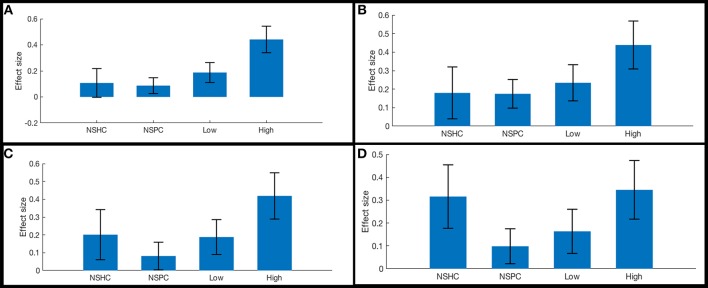
Figure 6.
Functional connectivity in cognitive control network ROI pairs by self-reported current suicidality. Bars illustrate mean effect sizes and 90% confidence intervals associated with lateral orbitals seeds by group. NSHC, non-suicidal healthy controls; NSPC, non-suicidal patient controls (PTSD diagnosis with IDS-SR Item #18 = 0), Low = PTSD with IDS-SR Item #18 = 1, and High = PTSD with IDS-SR Item #18 > 1. (A) left orbitalis-to-right dorsogenual BA 32. Connectivity differences between high- and low-suicidality, and high-suicidality vs. non-suicidal patients are significant after Bonferroni correction [both t(58) >5.0, p < 0.008]. (B) left orbitalis-to-left anterior BA 24. (C) left orbitalis-to-right anterior BA 24. (D) right orbitalis-to-right anterior BA 24.

