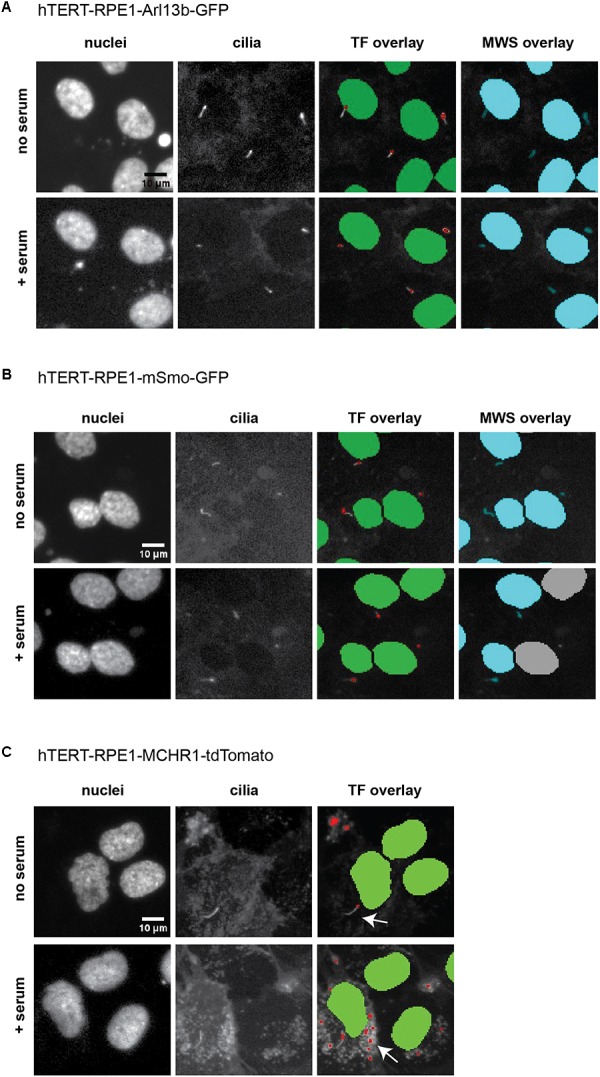
FIGURE 6.

ImageXpress images of cilia, emphasizing thresholding issues. Representative images of the three models of ciliation evaluated in this method, and typical image segmentation by MetaExpress software modules Transfluor (TF) and Multiwavelength Scoring (MWS). (A) hTERT-RPE1-Arl13b-EGFP. (B) hTERT-RPE1-SMO-EGFP. (C) hTERT-RPE1-tdTomato-MCHR1. Left panels show Hoechst stained nuclei, middle panels show labeled cilia, and right panels are representative image segmentation as recognized by the software (shown as an overlay of the cilia image. For TF, green is nuclear segmentation, red is the cilia segmentation; for MWS, nuclei and cilia are overlaid in cyan). For each cell model, no serum and + serum panels represent the same image field. In A, settings for both TF and MWS modules can be developed that discriminate between background and cilia; for B, settings for TF but not MWS can be used. The tdTomato-MCHR1 model, shown in C, has significant intracellular signal, particularly following addition of serum (see arrows in the right panel), which render automated counting unreliable by either TF or MWS approach.
