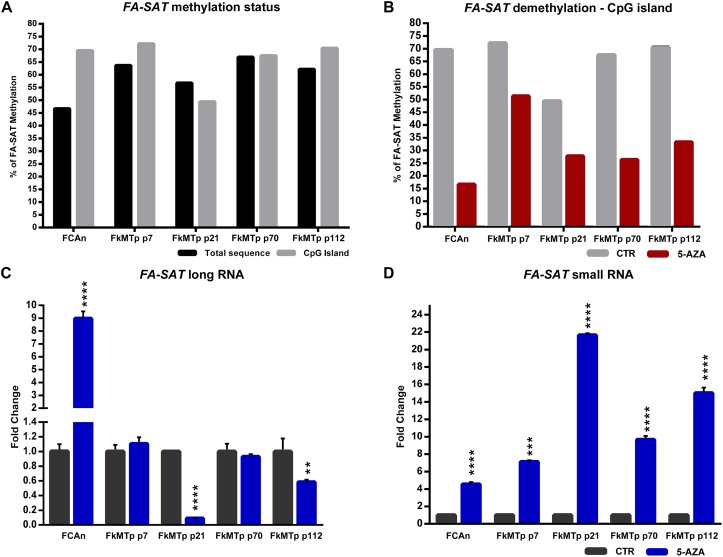
FIGURE 2.
FA-SAT is regulated by DNA methylation. (A) Graphical representation of the FA-SAT methylation percent values regarding the total 15 CpG sites analyzed (Total) and the 8 CpG island sites analyzed by bisulfite sequencing (Supplementary Figure 2a) of FCAn and of the different passages of FkMTp. (B) Graphical representation of the FA-SAT methylation percent values in the CpG island observed by bisulfite sequencing (Supplementary Figure 2a, analysis of the 15 CpG sites in Supplementary Figure 2c) of FCAn and the different passages of FkMTp in the control (CTR) and in the global demethylation of the genome (5-AZA). (C,D) Relative quantification of FA-SAT long (C) and small (D) RNA in FCAn and in the different passages of FkMTp in the azacytidine treatment using the respective control (without AZA) as reference. Values are mean ± SD of three replicates. ∗∗p ≤ 0.01, ∗∗∗p ≤ 0.001, ∗∗∗∗p ≤ 0.0001 as determined by Student’s T-test.

