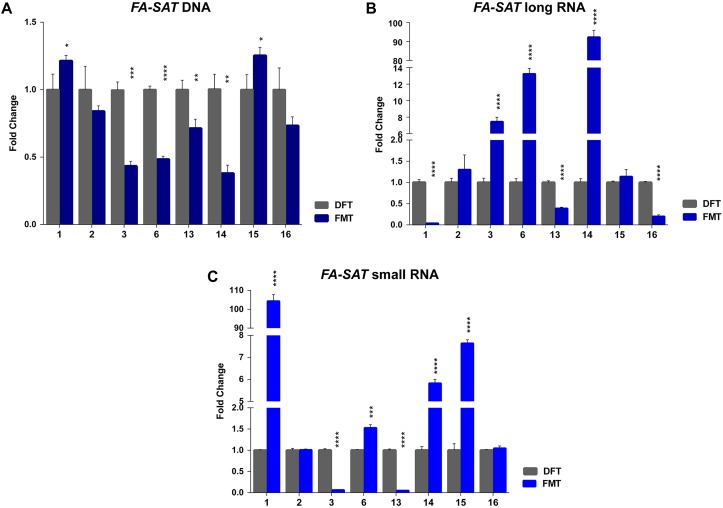
FIGURE 3.
FA-SAT DNA and RNA profiling in feline mammary tumors. (A–C) Fold change of FA-SAT DNA (A) and FA-SAT long (B) and small RNA (C) in feline mammary tumors (FMT) by real-time qPCR (DNA) and RT-qPCR (RNA) using a disease-free tissue (DFT) sample of the same individual as reference. Values are mean ± SD of three replicates. ∗∗∗p ≤ 0.001, ∗∗∗∗p ≤ 0.0001 as determined by Student’s t-test.

