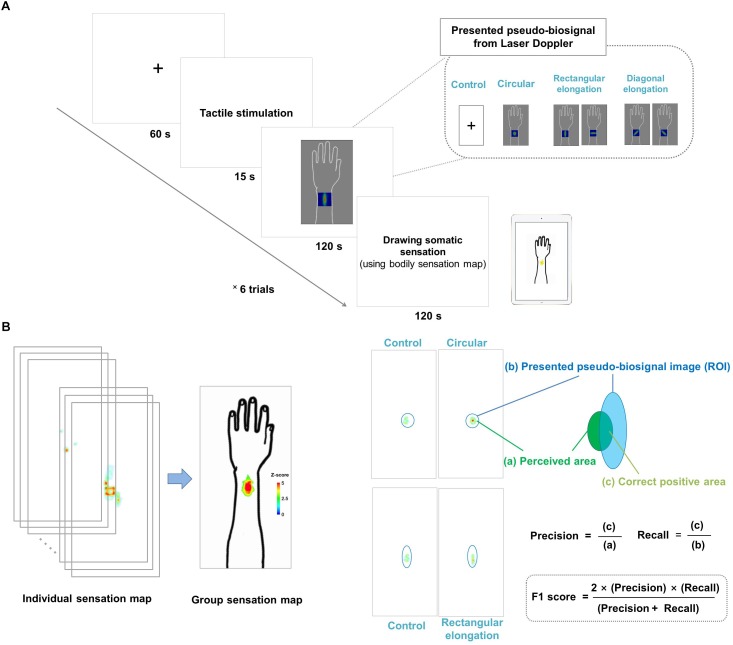
FIGURE 1.
(A) Experimental design. All participants were shown images of four different pseudo-biosignal shapes. Each participant received a tactile stimulation at the same site on the left arm using a von Frey filament. In each session, the participants were asked to report the location and intensity of the resulting sensation on a bodily sensation map tool. (B) Data visualization and data analysis. The spatial distributions of the somatic sensations were visualized using the human body template by applying Z scores. The F1 score was used to measure the similarity between the presented pseudo-biosignal image and reported somatic sensation area. The F1 score is calculated as (2 × precision × recall)/(precision + recall), where precision is the area of the correct positive results divided by the area of all relevant samples from the perceived de qi sensation area (c/a) and recall is the area of correct positive results divided by the area of all positive results from the region of interest of the presented pseudo-biosignal image (c/b).

