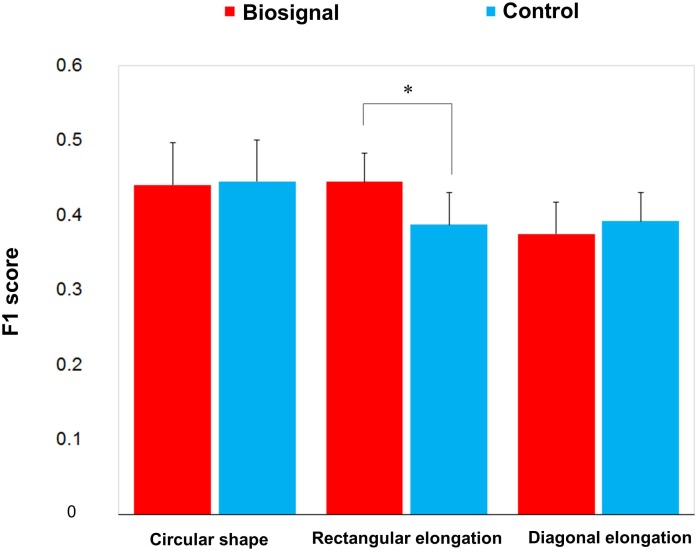
FIGURE 4.
Similarity between the presented biosignal images and de qi response images. The F1 score indicates the similarity between the presented pseudo-biosignal image and reported somatic sensation area. Presentation with the rectangular elongated-shaped pseudo-biosignal resulted in a greater similarity between the presented biosignal image and de qi response pattern compared to the control. The red bars represent the similarity with the pseudo-biosignal images and the blue bars represent the similarity without presentation of pseudo-biosignal images (control). A paired t-test was conducted to identify significant differences between the pseudo-biosignal image and control conditions. ∗represents p < 0.05.

