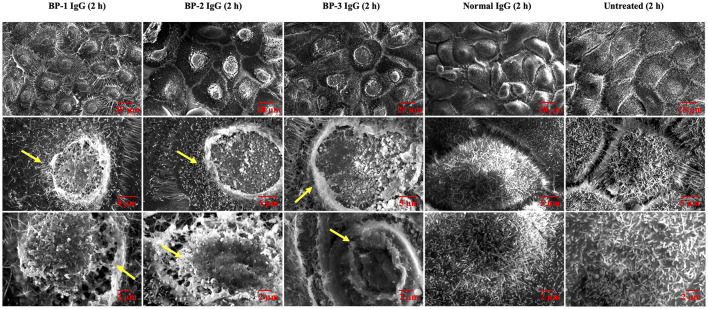
Figure 4.
SEM images of NHEKs stimulated with BP IgG. SEM images of NHEKs treated with BP IgGs (BP-1, BP-2, and BP-3) or normal IgG for 2 h. The lower magnification pictures show the connections of cells and filopodia. The higher magnification pictures show the cell surface and microvilli of individual cells. The alterations in the cell membrane structure are indicated with arrows.

