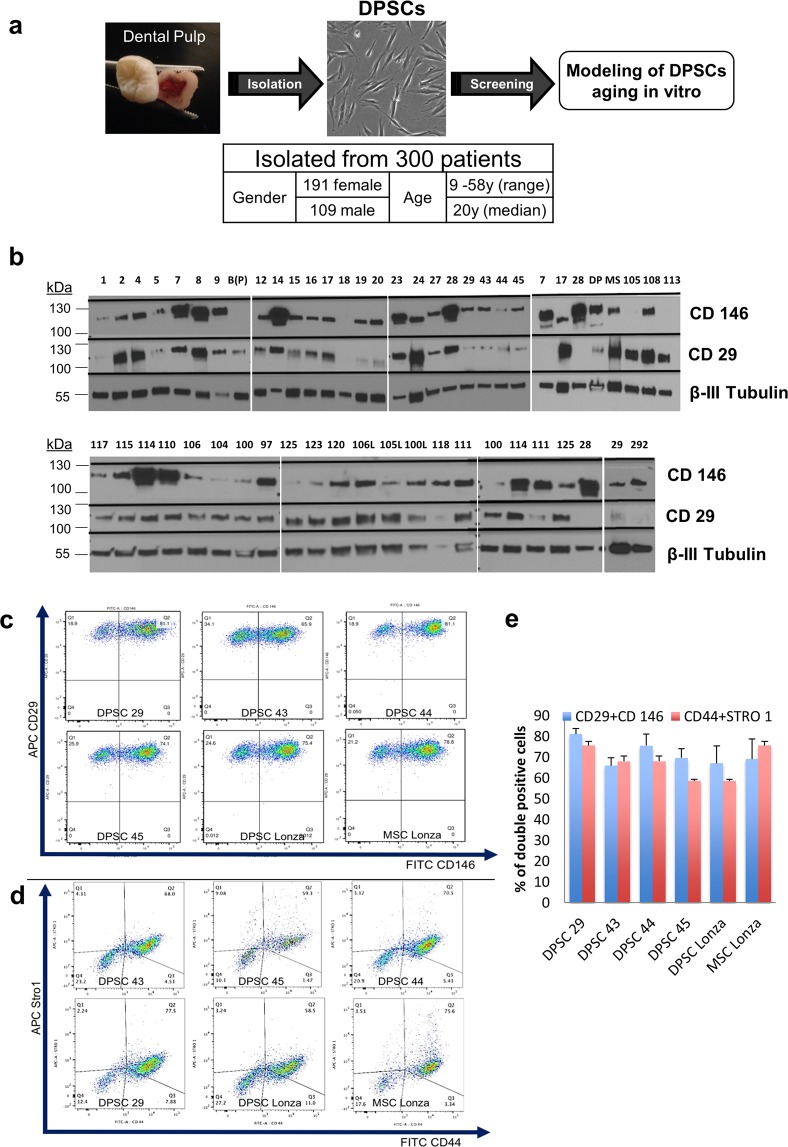
Figure 1.
Extraction summary and preliminary screening. (a) A simplified summary of the isolated DPSC lines and the initial project design to model DPSCs aging in vitro. (b) Preliminary screening of cell lines with cell surface markers, CD29 and CD146 using western blot shows differential expression of these markers. (c,d) Fluorescent cytometry of candidate cell lines (DPSC 29,44,43,45) demonstrates high percentage of mesenchymal markers; CD29+CD146+ cells (c) and CD44+Stro1+ cells (d). (e) A representative graph shows that the percentage of “double positive” were comparable with commercial DPSC and MSC cell lines from Lonza. (n = 3 per cell line). Graph error bars are the means ± standard error of the mean (SEM).

