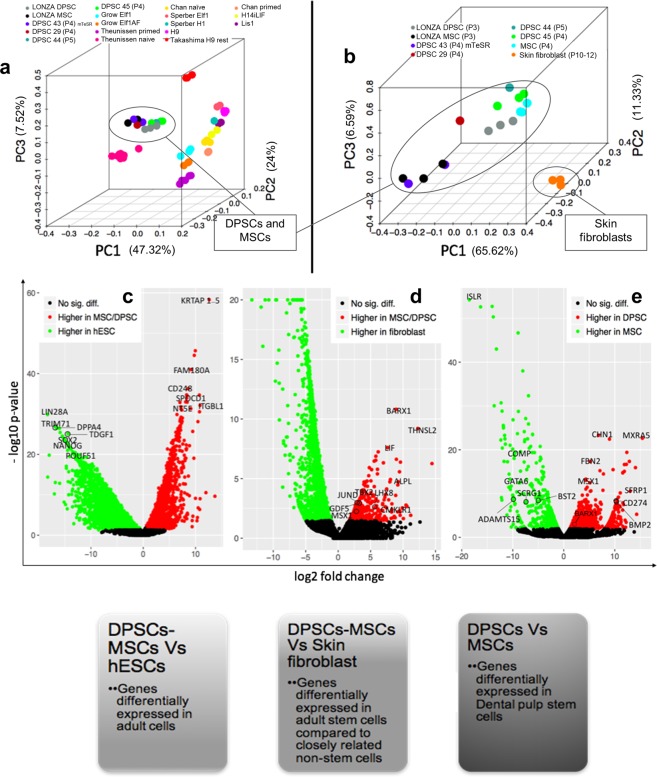
Figure 4.
The gene expression of DPSCs compared to MSCs, Fibroblasts and hESCs. (a) Principal component analysis (PCA) of DPSCs, MSCs and hESCs showed that DPSCs and MSCs grouped together. (b)Principal component analysis (PCA) of DPSCs with skin fibroblasts and MSCs from literature showed that DPSCs have distinct expression profiles from foreskin fibroblasts. (c) Volcano plot of genes differentially expressed in MSCs/DPSCs vs. hESCs. (d) Volcano plot of genes differentially expressed in MSCs/DPSCs compared to fibroblasts. (e) Volcano plot of genes differentially expressed in DPSCs vs. MSCs.

