Figure 3.
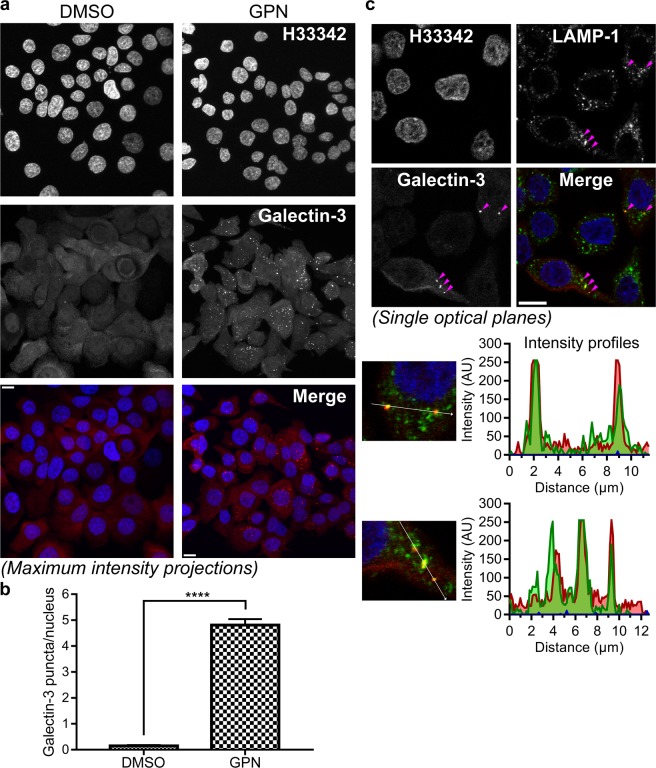
Rapid accumulation of galectin-3 around lysosomes upon chemically-induced lysosomal damage. (a) JIMT-1 breast cancer cells were treated with 0.3 mM glycyl-l-phenylalanine 2-naphthylamide (GPN) or 1% (v/v) dimethyl sulfoxide (DMSO) (used as control) for 13 minutes. The samples were then fixed, permeabilized, and stained to visualize nuclei (H33342) and galectin-3. Images are shown as maximum intensity projections of z-stacks obtained using confocal microscopy. Treatment with GPN induces distinct galectin-3 puncta in the cytosolic space of the cells. Scale bars are equal to 10 µm. (b) The mean number of galectin-3 puncta/nucleus from 74 or 92 images of cells treated with DMSO or GPN, respectively, from a total of 20 independent cell cultures for each treatment. The analysis was carried out in ImageJ on maximum intensity projections of z-stacks. The result is presented as mean values ± SEM, and the difference was statistically evaluated by an unpaired two-tailed t-test (****P < 0.0001). (c) JIMT-1 breast cancer cell treated with 0.3 mM GPN for 13 minutes and then stained to visualize lysosomal-associated membrane protein (LAMP)-1 and galectin-3. The images (single optical planes) show clear co-localization of galectin-3 accumulations with LAMP-1, seen best by observing the intensity profiles for the vectors highlighted in white, indicating that the galectins act in the vicinity of GPN-damaged lysosomes. In addition, LAMP-1 is present in many undamaged lysosomes, without galectin-3 accumulation. The images shown are representative of a larger number of images showing similar co-localization patterns. Arrowheads indicate areas of co-localization and have the same xy-coordinates in all images. Scale bars are equal to 10 µm.

