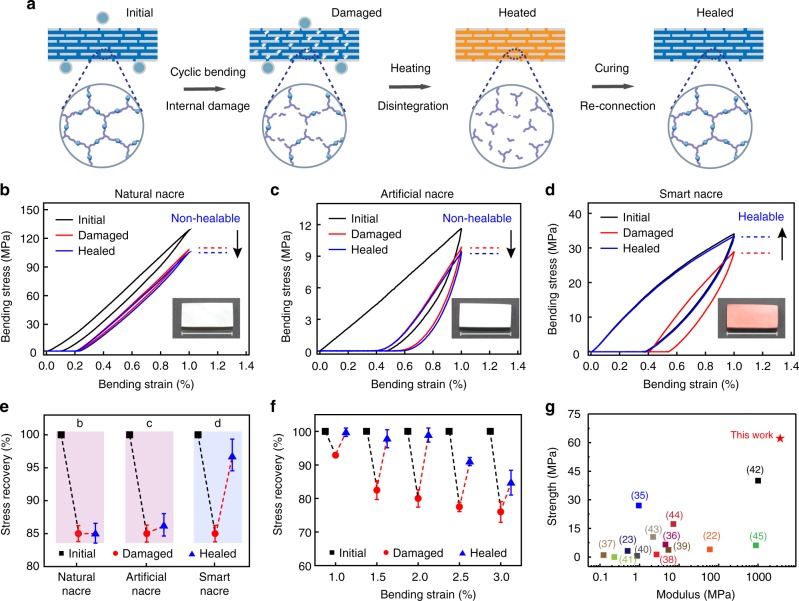
Fig. 3.
Self-healing mechanism of the smart nacre and its mechanical recovery behavior. a Schematic illustration of the damage-healing process of the smart nacre. Stress–strain curves recorded during the damage-healing process for a natural nacre (b), an artificial nacre infiltrated with non-healable polymer (c), and the smart nacre (d). Insets are the optical images for the corresponding samples. e Summary of the normalized strength for the initial, damaged, and healed specimens for the three types of samples in b–d. Summary of the normalized strength for the initial, damaged, and healed smart nacre, when damaged under different bending strain (f). g Ashby chart summarizing the strength vs. modulus of various self-healable materials. Error bars represent standard deviations calculated from five specimens. Scale bar in b–d is 2 cm

