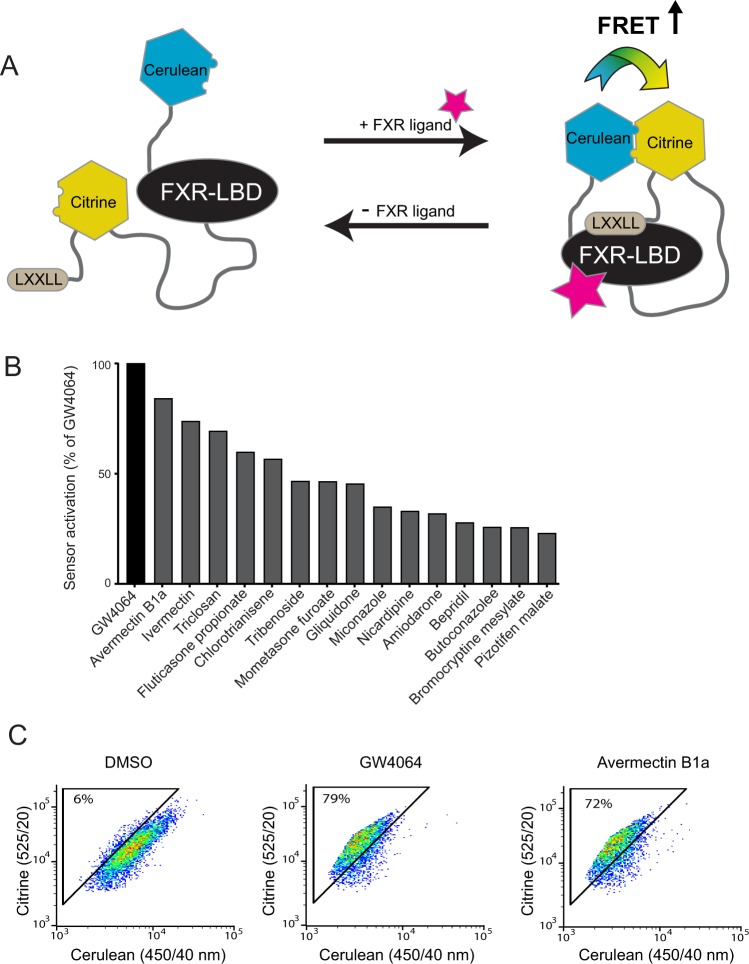
Figure 1.
High-throughput screening of FXR ligands using FRET-based flow cytometry. (A) working model of the FRET sensor. (B) Mean values of the fifteen strongest hits that increased the FRET+ cells for at least 20%. (C) Representative FACS-plots showing the amount of FRET+ cells after 30 minute treatment with negative control (DMSO), positive control (GW4064) or 10 μM of the top hit avermectin B1a. Numbers indicate the percentages of cells within the FRET gate.

