Fig. 1.
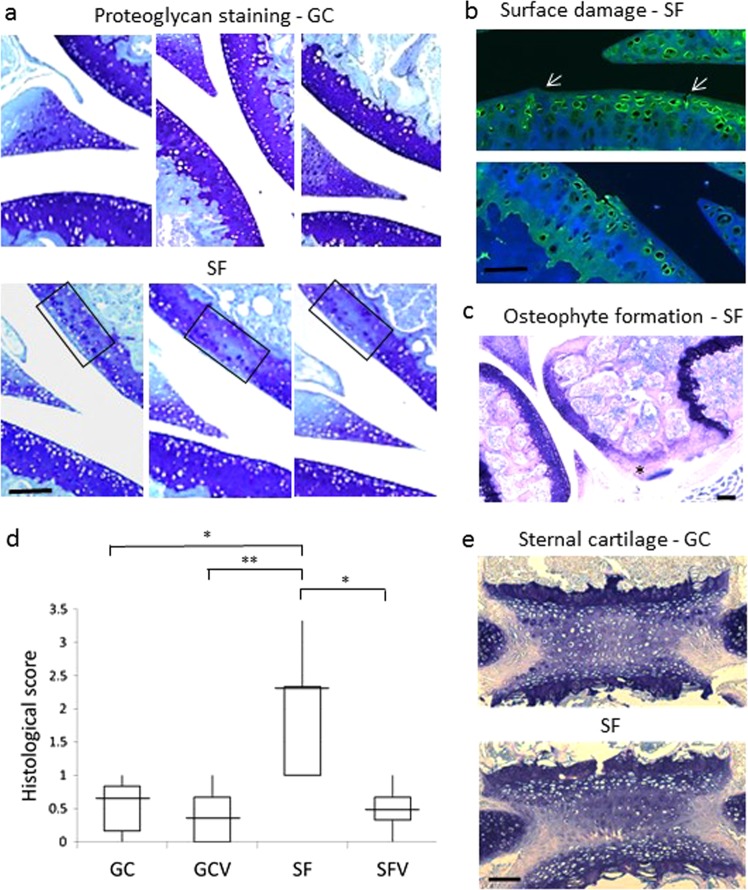
Histological analysis of spaceflight cartilage. a Proteoglycan analysis of articular cartilage. Sagittal sections of femoro-tibial joint were stained with toluidine blue for proteoglycan. The boxed region defines the area used to calculate the proportion of chondrocytes exhibiting pericellular proteoglycan in regions of reduced territorial proteoglycan. Scale bar is 100 μM. b Superficial zone damage. Sections were stained for collagen II. Several sections had surface irregularities. Note the uneven surface and fissure in the top panel (arrows) and damaged surface layer in the lower panel. Scale bar is 50 μM. c Presence of osteophytes. Representative image from a toluidine blue-stained SF sample showing evidence of an osteophyte (indicated by an asterisk) on the femoral condyle. Scale bar is 100 μM. d Histological scores for SF and non-flight controls (GC, GCV, and SFV). SF samples have a significantly higher histological score compared to ground and vivarium controls using the Kruskal–Wallis test (*P < 0.05, **P < 0.01). Median, maximum score, minimum score, and 25th and 75th percentile of total histology data are plotted for each experimental group. Scoring matrix is shown in Supplementary Table 1 and P-values for all pairwise combinations of experimental group histological scores shown in Supplementary Table 2. e Proteoglycan analysis of sternal cartilage. Representative sections of sternum from SF and GC mice cut in the coronal plane were stained for proteoglycan. The images show a single cartilaginous sternocostal synchondrosis flanked by the incoming ribs and the bony sternebrae above and below. Growth plate chondrocytes are located adjacent to the zones of calcified cartilage. Scale bar is 100 μM

