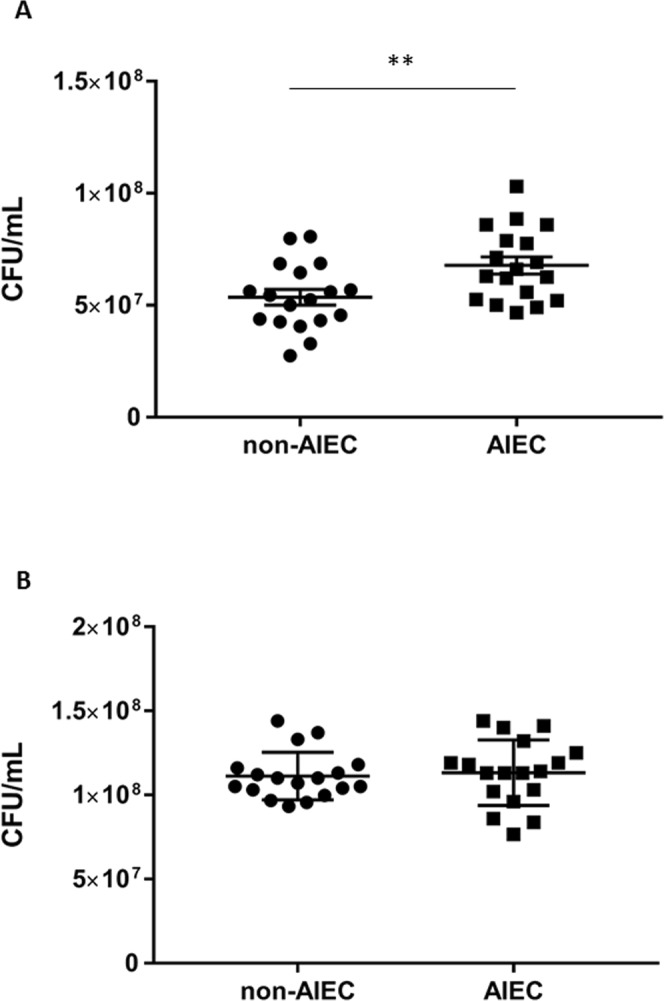
Figure 3.

Comparison of ethanolamine utilization in AIEC and non-AIEC strains after 24 h of incubation in minimal medium. Data are presented as mean values ± SEM of endpoint culture from AIEC (n = 18) and non-AIEC strains (n = 18) isolated of ileal mucosa of CD patients. (A) Number of bacteria in mM9b supplemented with ethanolamine after incubation for 24 h at 37 °C. (B) Number of bacteria in mM9b supplemented with glucose and NH4Cl after incubation for 24 h at 37 °C. The growth of AIEC strains in mM9b-EA was slightly higher than that of non-AIEC strains. Values of each strains are means of two independent experiments. Statistical analysis was performed using a Student’s t test; **p < 0.01.
