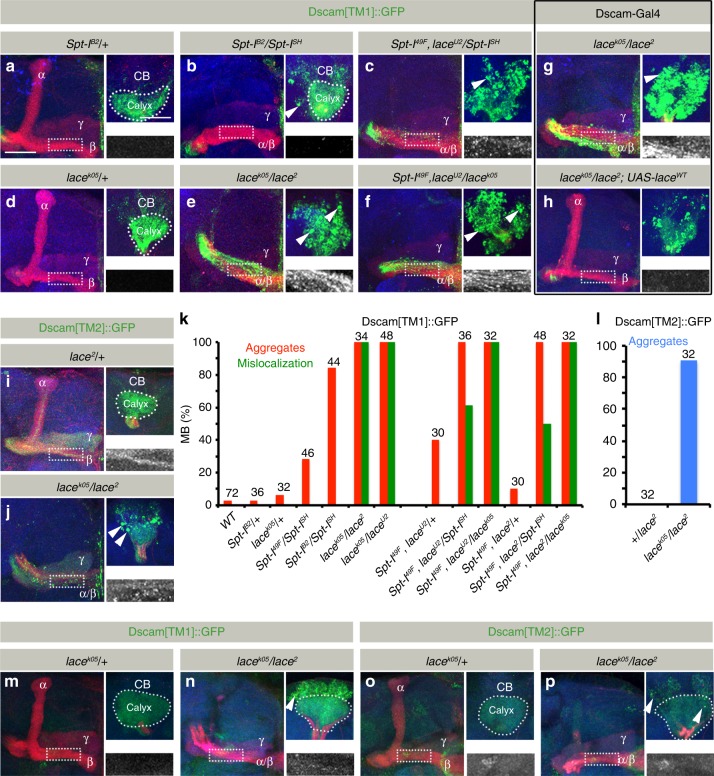
Fig. 3.
SPT mutants affect intra-cellular Dscam localization. a–f Pan-kenyon cell (OK107-Gal4) expression of Dscam[TM1]::GFP shows formation of aggregates in SPT mutants. While images a–f represent the axonal half of the MB, the corresponding somato-dendritic area of the same MB is represented in right upper insets. The white dotted rectangle represents the Dscam[TM1]::GFP distribution in the axons, zoomed in and shown in the right lower inset. While Spt-I trans-heterozygotes primarily show formation of Dscam[TM1]::GFP aggregates (b, k), an additional lace heterozygous mutation enhances the phenotype and leads to mislocalization of Dscam[TM1]::GFP into the axons (c, k). lace trans-heterozygous mutants are inherently stronger than Spt-I mutants and show a high penetrance of Dscam[TM1]::GFP aggregates and axonal mislocalization (e, f, k). g, h Like OK107-Gal4, expression of Dscam[TM1]::GFP using Dscam-Gal4 shows formation of somatic aggregates and axonal mislocalization in lace trans-heterozygous mutants (g), which can be rescued by co-expressing a lace wild-type transgene (h). n(g) = 34, n(h) = 30. i, j Expression of Dscam[TM2]::GFP using 201Y-Gal4 also shows formation of somatic aggregates in lace trans-heterozygous background (j, l). k Percentage of MB showing somatic aggregates and axonal mislocalization of Dscam[TM1]::GFP. l Percentage of MB showing somatic aggregates of Dscam[TM2]::GFP. Numbers on the bars represent number of MB analyzed. m–p Dscam[TM1::GFP] (m, n) and Dscam[TM2::GFP] (o, p) expressed downsteam of Dscam regulatory region shows formation of somatic aggregates (in addition to axonal mislocalization of Dscam[TM1]) in SPT mutants (n,p) as compared to control (m, o). n(m) = 16, n(n) = 18, n(o) = 16, n(p) = 30. a–j, m–p Green: GFP, Red: FasII, Blue: N-Cad. Arrowheads indicate somatic aggregates of Dscam. Scale Bar: 25 μm

