Fig. 8.

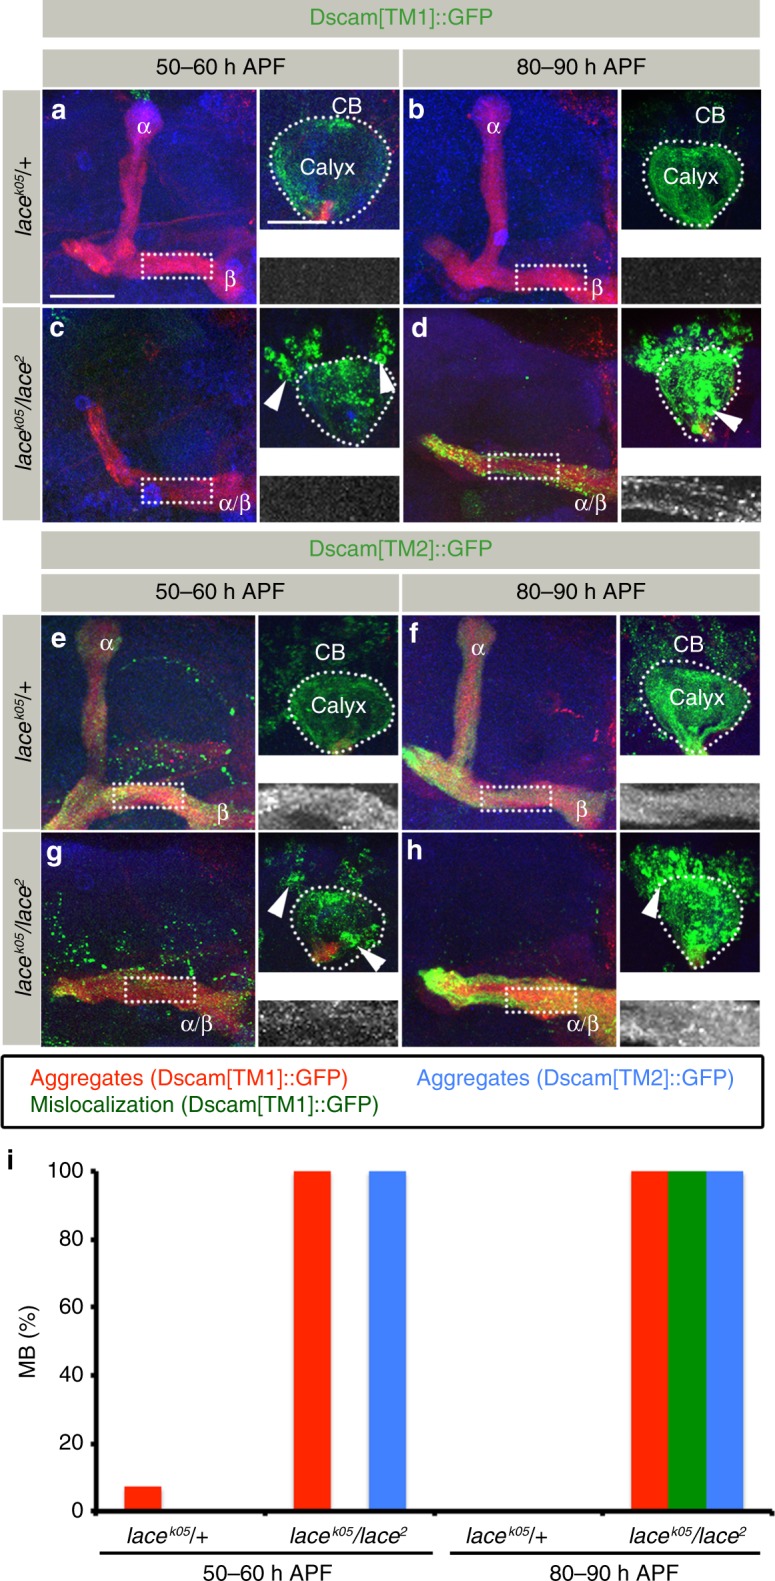
Dscam aggregates show intra-cellular translocation in SPT mutants. a–d Distribution of Dscam[TM1]::GFP in lacek05/ + (a, b) and lace2/lacek05 (c, d) at two pupal developmental stages: 50–60 h APF (a, c) and 80–90 h APF (b, d) expressed using α/β neuron-specific Gal4 (R65G04-Gal4). While images a–d represent the axonal half of the MB, the corresponding somato-dendritic area is represented in right upper insets. The white dotted rectangle represents Dscam[TM1]::GFP distribution in the axons, zoomed in and shown in the right lower inset. Dscam[TM1]::GFP shows an early formation of aggregates ((c), arrowheads) followed by axonal mislocalization (d) in lace mutants. n(a) = 14, n(b) = 14, n(c) = 14, n(d) = 12. e–h Distribution of Dscam[TM2]::GFP in lacek05/ + (e, f) and lace2/lacek05 (g, h) at two pupal developmental stages: 50–60 h APF (e, g) and 80–90 h APF (f, h) expressed using α/β neuron-specific Gal4 (R65G04-Gal4). Dscam[TM2]::GFP shows reduced axonal localization early in development with formation of somato-dendritic aggregates (Compare (e) and (g), arrowheads) in SPT mutants. This is followed by a non-homogeneous distribution in the axons (h). n(e) = 18, n(f) = 8, n(g) = 8, n(h) = 20. i Percentage of MB showing somatic aggregates and axonal mislocalization of Dscam[TM1]::GFP and Dscam[TM2]::GFP in MB at different developmental times. a–h Green: GFP, Red: FasII, Blue: N-Cad. Arrowheads indicate somatic aggregates of Dscam. Scale Bar: 25 μm
