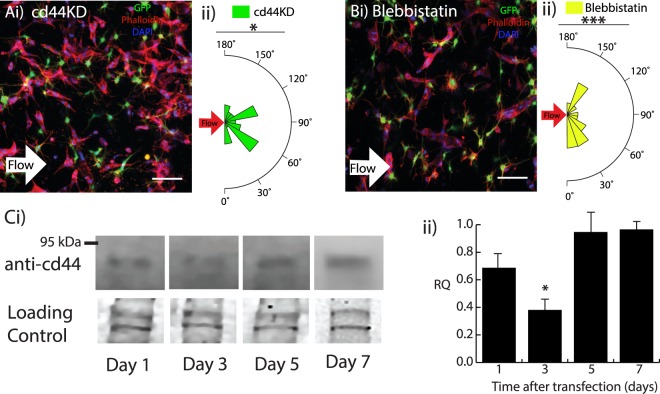
Figure 3.
Disruption of 3D microvessel alignment. (Ai) Day 5 scaffold exposed to interstitial fluid flow (direction denoted by white arrow) with hCMEC/D3 cd44KD cells and microvessel alignment plot (ii). (Bi) Day 5 hydrogel exposed to interstitial fluid flow with 0.5 μM blebbistatin and microvessel alignment plot (ii). GFP hBVP (green), Phalloidin-Texas Red (red), and DAPI (blue). Scale bars, 100 μm. (C,i) Western blot of cd44 protein expression levels from day 1 after transfection to day 7 and (ii) bar graph showing cd44 protein expression levels as relative intensity (RQ) normalized to day 7 values. Coomassie blue was used to control for gel loading. Data are presented as mean ± s.e.m. *P < 0.05, ***P < 0.001; statistical significance was calculated using Welch Two Sample t-test. Alignment values (n = 30) are from single samples per condition.

