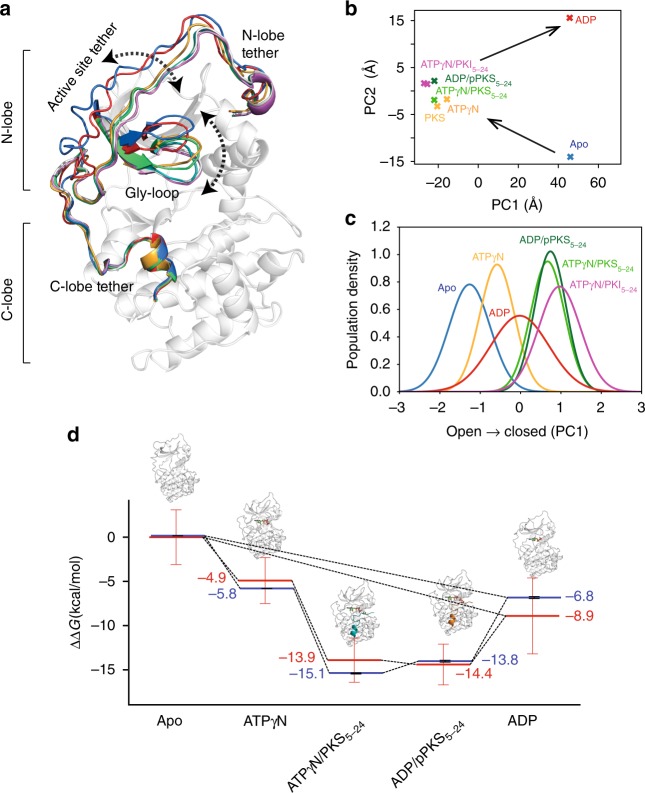
Fig. 1.
Conformational transition of PKA-C during turnover. a Superposition of the X-ray crystal structures of PKA-C in the apo (PDB code: 4NTS), binary complex (ATPγN-bound, PDB code: 1BKX), ternary complex (ATPγN and PKS5-24, PDB code: 4DG0), ternary/exit complex (ADP and pPKS bound, PDB code: 4IAF), and binary (ADP-bound, PDB code: 4NTT). Dotted arrows indicate the major domains involved in large amplitude motions determining opening and closing of the nucleotide site and substrate hub. b Principal component analysis (PCA) with the two main components indicating the structural transitions in the crystal structures of PKA-C for different ligated states, where PC1 and PC2 involve distinct collective motions throughout the protein (illustrated in Supplementary Fig. 1). c CONCISE plot showing the probability distribution curves of the methyl chemical shifts for the different states along the open-to-close trajectories. d Changes in the free energy of binding (ΔΔG) determined by ITC (blue) measurements (mean ± SD, n = 3) compared with the ΔΔG obtained from the CONCISE analysis (red) that estimates the relative population of the bound states. The CONCISE data are obtained from probability density distributions of the NMR chemical shifts for the ILV methyl groups of PKA-C, where the error bar reports the 90% confidence interval. The data of the CONCISE plots are reported in the Source Data file

