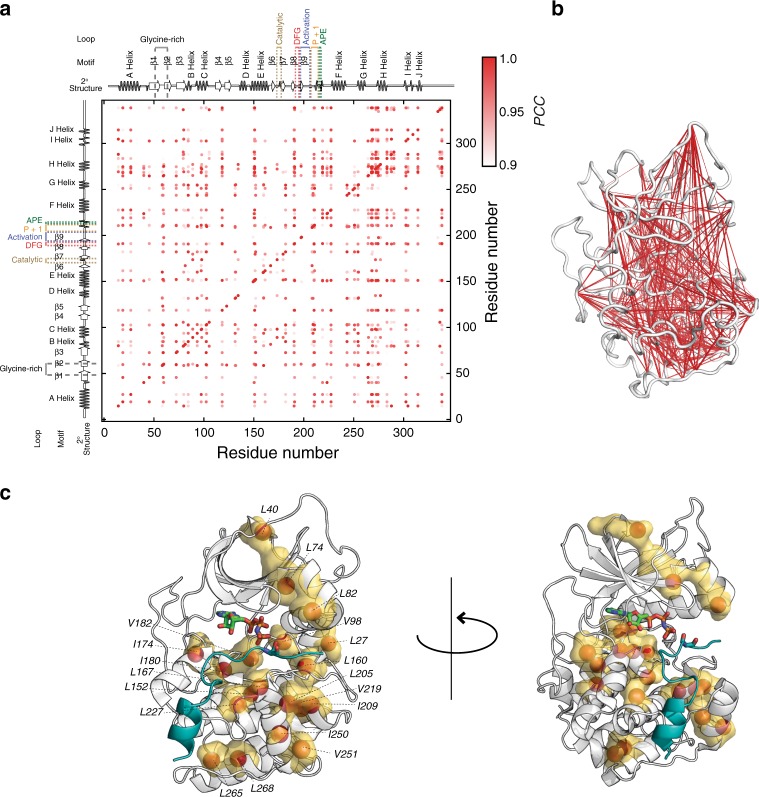
Fig. 3.
Correlated motions orchestrate positive and negative cooperativity. a Covariance plot indicating the coordinated changes of methyl group order parameters (O2) throughout the entire kinase. The diagonal peaks in the plots represent the assigned methyl groups, while cross peaks indicate the degree of correlation of the methyl group O2 using Pearson coefficient as a metric. Methyl group dynamics changes are considered coordinated when the Pearson coefficient is greater than 0.9. b Network plot connecting the methyl groups the highest values of covariance. c Mapping of the methyl groups that show a significant difference in order parameters upon forming the ternary complexes, i.e., PKA-C/ATPγN/PKS5–24 and PKA-C/ADP/pPKS5–24, from the binary complexes bound with nucleotide, respectively (see Supplementary Fig. 12)

