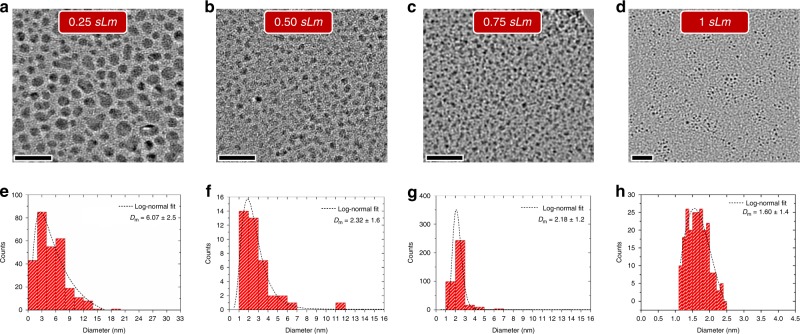
Fig. 2.
Morphology of tin nanocrystals. a–d Transmission electron micrographs of Sn nanocrystals (NCs) prepared at 0.25 sLm, 0.5 sLm, 0.75 sLm and 1.0 sLm respectively; (e–h) bar charts showing size distribution of the NCs corresponding to the same micrographs in (a–d) with the average size of 6.07, 2.32, 2.18 and 1.60 nm respectively. The dashed curve represents the log-normal fit to the distribution. The scale bars in (a–d) is equal to 20 nm and the sLm corresponds to standard liter per minute

