Fig. 3.
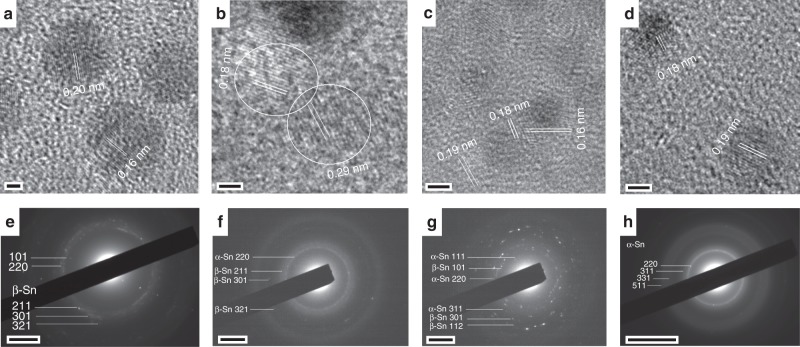
Crystal structural transformations in tin nanocrystals. a–d Representative high-resolution transmission electron micrographs corresponding to Sn nanocrystals (NCs) prepared at 0.25 sLm, 0.5 sLm, 0.75 sLm and 1.0 sLm and with corresponding average diameter of 6.07, 2.32, 2.18 and 1.60 nm; (e–h) representative selected area electron diffraction patterns of the Sn NCs. The scale bars in (a–d) is 2 nm, in (e–g) is 2 nm−1 and in (h) is 5 nm−1

