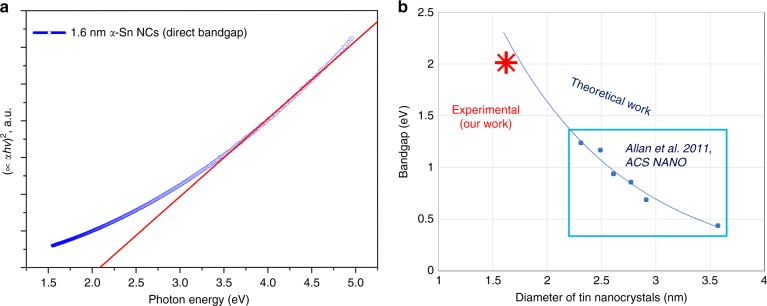
Fig. 4.
Quantum confinement induced bandgap widening in tin (Sn) nanocrystals (NCs). a Tauc plot of 1.6 nm Sn NCs and linear fit which estimates the bandgap to be 2.2 eV; as per Tauc plot of direct semiconductors, C’ is the proportionality constant, α is the absorption coefficient, hν is the energy (h is Planck’s constant and ν is the frequency). b Bandgap values (blue dots) for Sn NCs from theoretical calculations26 and fitted exponential curve (blue line). The red star corresponds to our experimental result

