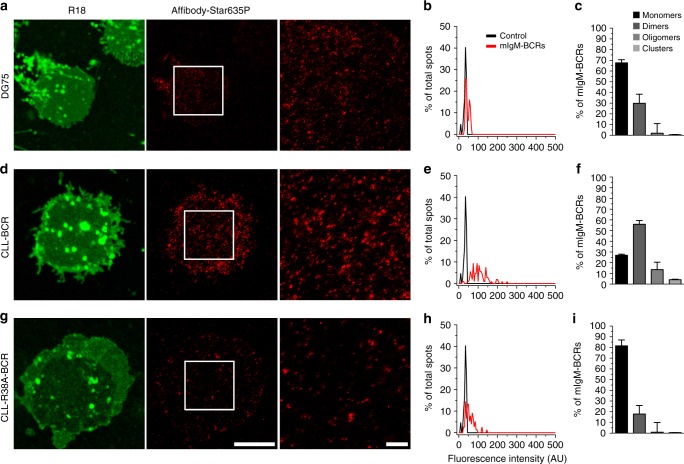
Fig. 3.
Cell surface arrangement of a CLL-derived mIgM-BCR. a, d, g Plasma membrane sheets of DG75 B cells (a), an mIgMneg variant expressing a CLL-derived mIgM-BCR (CLL-BCR, d) or the R38A-mutant variant thereof (CLL-R38A-BCR, g) were analyzed as in Fig. 1. White squares indicate the zoomed regions. Scale bars represent 5 µm for the low zoom images and 1 µm for the high zoom STED images. b, e, h Example histograms of the spot fluorescence intensities for each cell type. c, f, i Percentages of different mIgM-BCR arrangements were derived as in Fig. 1. Data were obtained from three independent experiments including 16 membranes for DG75, 17 membranes for the CLL-BCR, and 12 membranes for the CLL-R38A-BCR (raw data in Supplementary Fig. 5). Error bars represent the 68% confidence interval, corresponding to 1 standard deviation. Histogram’s source data are provided as a Source Data file

