Fig. 1.
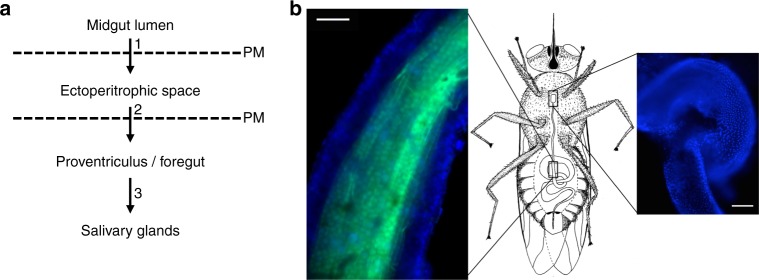
Course of migration by trypanosomes and anatomical context in the tsetse fly. a Schematic depiction of the path taken by trypanosomes during cyclic transmission, with numbers 1–3 marking major tissue transitions. PM: peritrophic matrix. b Schematic of a tsetse fly (central panel), with boxed regions indicating the location of the midgut (left panel) and proventriculus (right panel). Left panel, an isolated tsetse fly midgut in which the nuclei of epithelial cells are stained with Hoechst dye (blue) and the PM is stained with fluorescein-tagged wheat germ agglutinin (green). Right panel, an isolated tsetse fly proventriculus stained with Hoechst dye (blue) to visualize nuclei. Scale bar: 100 microns

