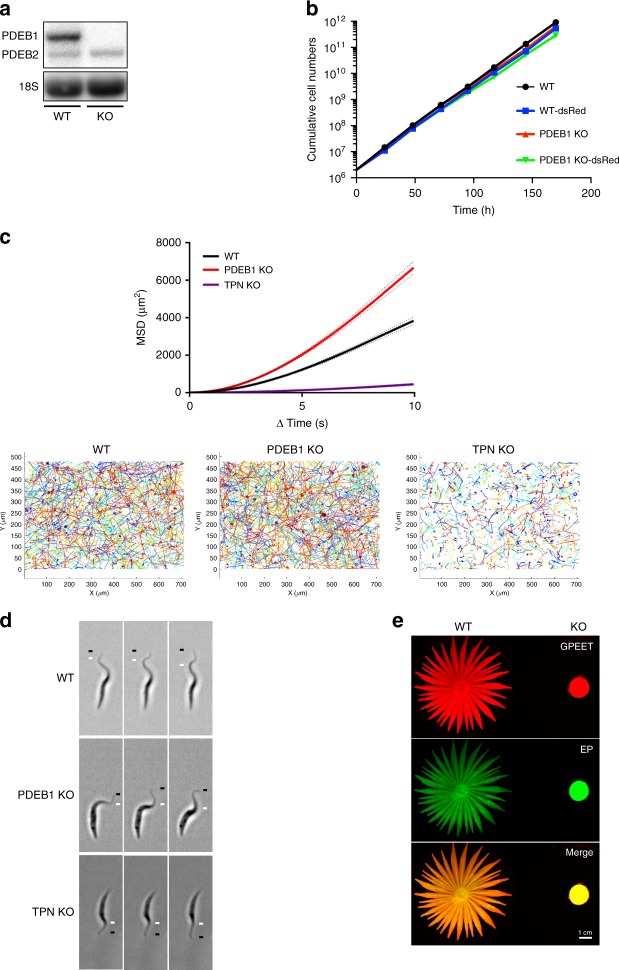
Fig. 2.
Effect of PDEB1 knockout on SoMo, growth and motility. a Northern blot analysis of RNA prepared from wild-type parental cells (WT) or PDEB1 knockout cells (KO). Blots were hybridized with a probe corresponding to the coding region of PDEB1. PDEB2 is 93% identical to PDEB1 and the probe cross-hybridizes weakly under the conditions used. 18S rRNA serves as a loading control66. b Comparison of population doubling times of WT, KO, WT-dsRed, and KO-dsRed cell lines in suspension culture over the course of 7 days. Cell densities were adjusted daily to 3 × 10⁶ cells ml−1 in order to ensure logarithmic growth. c Mean-squared displacement (MSD) is measured for WT, PDEB1 KO, and trypanin knockout (TPN KO) cells. Results are from three biological replicates and a total of n = 1449 cell traces for WT, n = 1339 cell traces for KO, and n = 1208 cell traces for TPN KO from a total of 34 videos for each. Dotted lines represent standard error of the mean (SEM). Cell traces from the 34 videos are superimposed over each other for WT, PDEB1 KO, and TPN KO, respectively. d Still images from high-speed videos of WT, PDEB1 KO, and TPN KO cells taken at 496 frames per second under x20 magnification. Each series of images shows one cell per genotype at six millisecond intervals. The black line indicates the flagellum tip, and the white line indicates the peak of the flagellar wave. See supplemental information for Supplementary Movies 1–3. e Social motility assays were performed with WT and KO cells. Community lifts36 were performed and incubated with anti-EP (green) and anti-GPEET (red) antibodies

