
Figure 2.
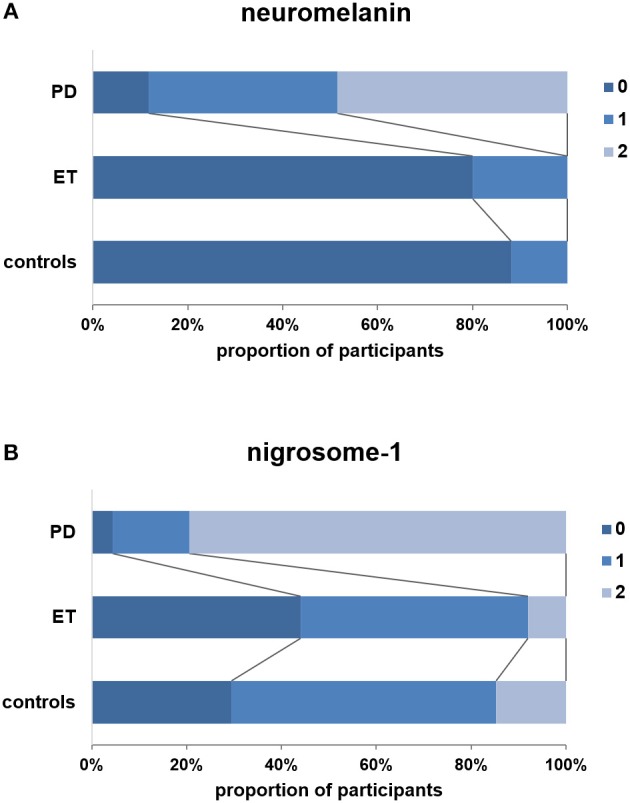
Visual scores (3-point ordinal scale) for patients with PD, patients with ET, and controls. (A) Visual scores for neuromelanin. (B) Visual scores for nigrosome-1. Note that no definitely abnormal neuromelanin signals (score: 2) were observed in the ET and control groups, and the frequency of nigrosome-1 absence (score: 2) was significantly lower in the ET group than in the PD group (p < 0.001).