Fig. 2.
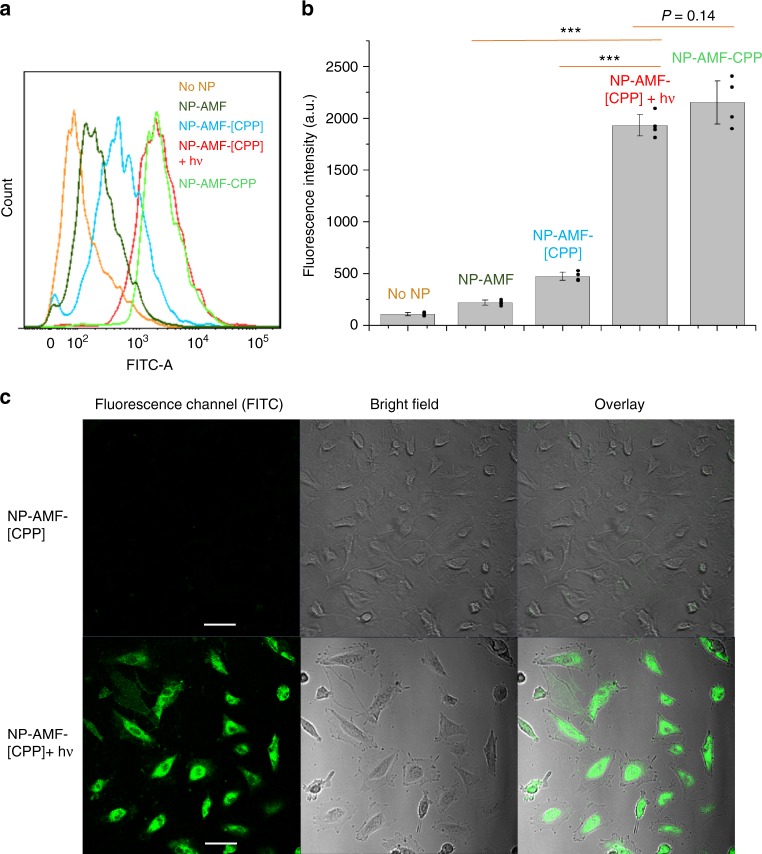
Light-triggered cell uptake of nanoparticles. a Representative flow cytometry of FITC fluorescence within HUVEC cells treated with different nanoparticles or without nanoparticle. b Quantitation (mean of four median values of fluorescence intensity) of flow cytometric analyses (such as the one in panel A) of HUVEC uptake of nanoparticles. Data are means ± SD (n = 4 independent experiments). ***P < 0.001 (unpaired t-test). c Representative confocal microscopic images of HUVEC uptake of nanoparticles. The scale bar is 20 μm

