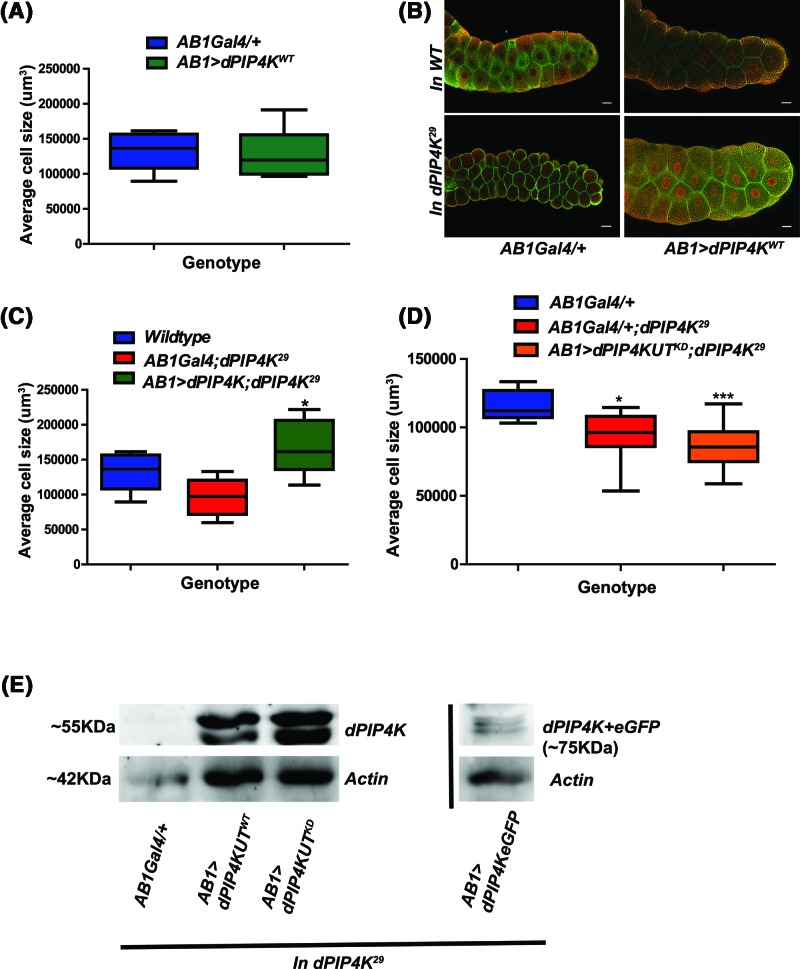
Figure 1. dPIP4K functions in modulating cell size in larval salivary glands.
(A) Graph representing average cell size measurement (μm3) as mean ± S.E.M. of salivary glands from wandering third instar larvae of AB1Gal4/+ and overexpression of AB1>dPIP4KWT, n=5. No significant change was observed when analysed by unpaired t test. (B) Representative confocal images of salivary glands from the genotypes a. AB1Gal4/+ b. AB1>dPIP4KWT c. AB1Gal4/+;dPIP4K29 and d. AB1>dPIP4KWT;dPIP4K29 showing cell size changes quantified in the earlier graph. Cell body is marked green by Bodipy conjugated lipid dye, nucleus is marked by TOTO3 shown in red. Scale bar indicated at 50 μm. Images are contrast adjusted for representation. (C) Graph representing average cell size (μm3) measurements as mean ± S.E.M. on reconstitution of dPIP4KWT in the background of dPIP4K29 as compared with AB1Gal4/+;dPIP4K29, n=8. *P-value <0.05. (D) Graph representing average cell size (μm3) measurements as mean ± S.E.M. on reconstitution of dPIP4KUTKD (where ‘UT’ indicates untagged protein) in the background of dPIP4K29 as compared with AB1Gal4/+; dPIP4K29, n=8. *P-value <0.05, ***P-value <0.01. (E) Comparison of protein levels between dPIP4KUTWT and dPIP4KUTKD as compared with AB1Gal4/+;dPIP4K29 control in larval salivary glands, as seen on a Western blot probed by dPIP4K antibody. dPIP4K::eGFP which migrates ∼25 kDa higher than the untagged protein represented separately. Actin was used as the loading control for all.

