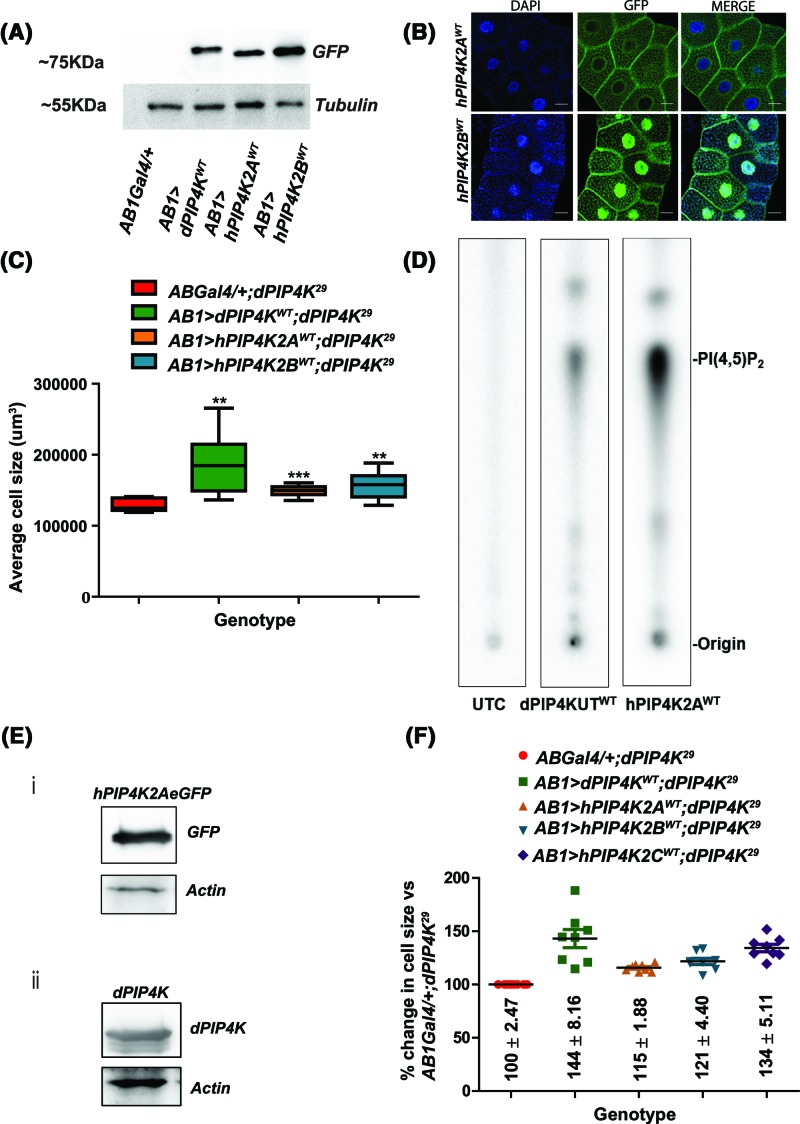
Figure 3. Reconstitution of the high specific activity PIP4Ks:hPIP4K2A and hPIP4K2B reverts cell size reduction seen in dPIP4K29.
(A) Western blot showing the protein levels of human PIP4Ks as compared with dPIP4K seen using anti-GFP. Tubulin was used as the loading control. (B) Confocal images of salivary glands expressing GFP-tagged hPIP4K2A and hPIP4K2B in background of dPIP4K29 along with DAPI staining the nucleus in blue. Scale bar indicated at 20 μm. Images are contrast-adjusted for representation. (C) Graph representing average cell size measurement (μm3) as mean ± S.E.M. for heterologous reconstitution of hPIP4K2Aand hPIP4K2A as compared with dPIP4KWT expression in AB1Gal4 in dPIP4K29, n=8, **P-value <0.05, ***P<0.001. (D) TLC image showing activity for hPIP4K2A and dPIP4KWT as compared with an untransfected control (UTC). The expected spot representing PIP2 generation is marked on the right. (E) Western blot image showing protein levels of (i) hPIP4K2A and (ii) dPIP4KWT in the lysate used for kinase assay. Actin was used as a loading control in both cases. (F) Ratiometric analysis of change in cell size measured as a % change is represented for reconstitution of dPIP4KWT, hPIP4K2A, hPIP4K2B and hPIP4K2C with respective individual experimental AB1Gal4/+;dPIP4K29 control.

