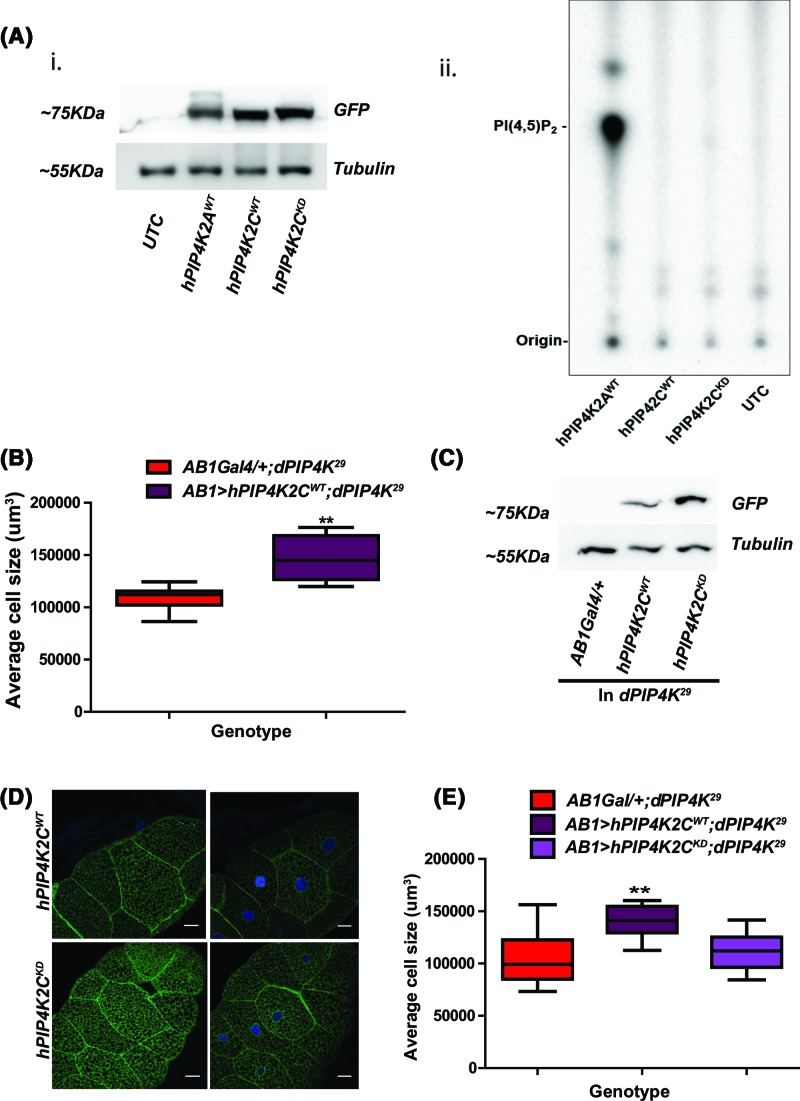
Figure 4. Reconstitution of low specific activity containing PIP4K: hPIP4K2C restores the cell size reduction seen in dPIP4K29.
(A) PI5P kinase activity assay. (i) Immunoblot from lysates of S2R+ cells expressing hPIP4K. (ii) S2R+ cell-free lysate expressing PIP4 kinases (10 μg) from indicated human isoforms was incubated for 16 h at 30°C with physiological (6 μM) concentration of PI5P and 0.5 μCi [γ32P] ATP. The assay reaction was terminated by adding 2.4 M HCl followed by methanol and chloroform. The lipids were extracted and resolved on TLC plate using chloroform:methanol:water:25% ammonia (45:35:8:2). UTC, untransfected cells; hPIP4K2AWT, human PIP4 kinase α isoform wild-type; hPIP4K2CWT, human PIP4Kinase γ isoform wild-type; hPIP4K2C KD. (B) Graph representing average cell size measurement (μm3) as mean ± S.E.M. for heterologous reconstitution of hPIP4K2C as compared with AB1Gal4/+;dPIP4K29, n=7 or more, **P-value <0.05. (C) Immunoblot showing the comparison of expression between of hPIP4K2CWT or hPIP4K2CKD from salivary gland lysates and probed with anti-GFP. Tubulin was used as the loading control. (D) Confocal images of salivary glands expressing hPIP4K2CWT or hPIP4K2CKD where green represents GFP-tagged transgenic protein expressed in dPIP4K29 and DAPI stains nucleus shown in blue. Scale bar indicated at 20 μm. Images are contrast adjusted for representation. (E) Graph representing average cell size measurement (μm3) as mean ± S.E.M. for heterologous reconstitution of hPIP4K2CWT or hPIP4K2C KD as compared with AB1Gal4/+;dPIP4K29, n=7 or more, *P-value <0.01, **<0.05.

