
Figure 2.
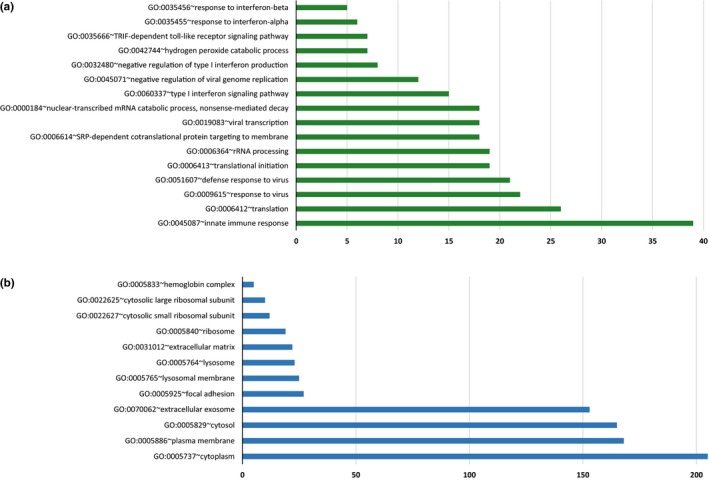
Frequencies of GO terms evoked by the significant target genes possibly implicated in PedMS cognitive dysfunctions. Histogram illustrates the GO terms (a: biological processes; b: cellular components) associated with assembled subnetworks (DAVID software v6.8). Please note that this analysis was performed by using all the predicted target genes (computationally or experimentally validated, see Methods for details) of the significant 11 miRNAs correlating with the score of the different cognitive performances (either up‐ or down‐regulated genes)