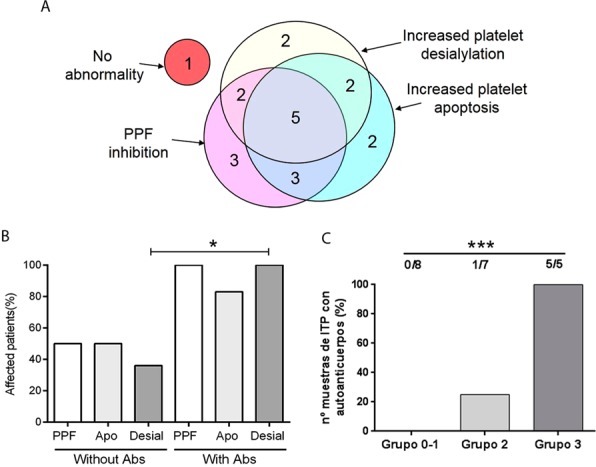
Figure 4.

Frequency of abnormalities in ITP patients. (A) Venn diagram showing the number of patients/samples displaying increased platelet apoptosis, increased platelet desialylation and/or inhibition of proplatelet formation (PPF) in the ITP population studied (n = 20). (B) Incidence of platelet apoptosis (Apo), platelet desialylation (Desial) and inhibition of PPF (PPF) in patients according to the presence (with Abs) or absence (without Abs) of autoantibodies (Fisher’s exact test, *P < 0.05). (C) Percentage of ITP patients with detectable levels of platelet autoantibodies according to the number of defects observed (Group 0-1, patients harbouring none or only one defect, including inhibition in PPF, increased platelet desialylation or apoptosis; Group 2, patients with 2 abnormalities; Group 3, patients displaying impaired PPF, increased platelet desialylation and platelet apoptosis) (Chi-square test, ***P < 0.001).
