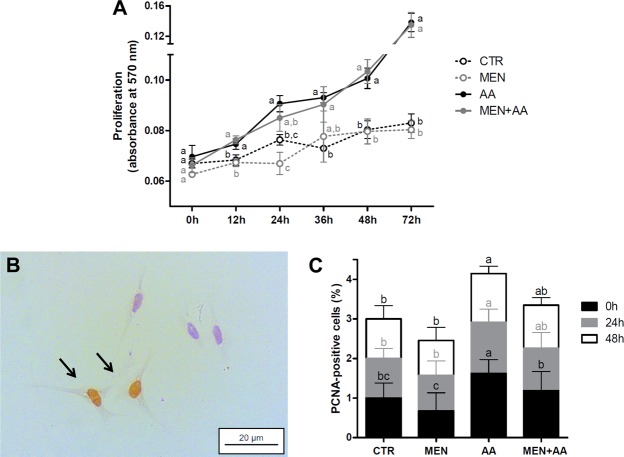
Figure 2.
Myoblast proliferation. Cell proliferation was evaluated in myoblasts incubated with menadione (MEN), ascorbic acid (AA), menadione combined with ascorbic acid (MEN + AA) or without treatment (CTR). Ascorbic acid was administered at 200 μM to AA and MEN + AA myoblasts, and menadione was administered at 10 µM to MEN and MEN + AA myoblasts. (A) MTT assay. Myoblast proliferation was measured considering the absorbance variation 0, 12, 24, 36, 48 and 72 hours after day 1. The data are expressed as the absorbance at 570 nm and presented as the mean ± SD of duplicates from three independent cell cultures. (B) PCNA immunostaining. Representative image of PCNA immunostaining in myoblasts in the CTR group on day 1. Arrows indicate PCNA-positive myoblasts. Image was obtained under a light microscope at a 40x magnification (Bars: 20 µm). (C) Quantification of PCNA-positive cells. Myoblast proliferation was measured considering the percentage of PCNA-stained nuclei 0, 24 and 48 hours after day 1. The data are expressed as the fold change compared with the CTR group and presented as the mean ± SD of duplicates from three independent cell cultures. The different letters indicate significant differences among the groups (p < 0.05 - One-way ANOVA test, followed by Tukey’s multiple comparisons test).

