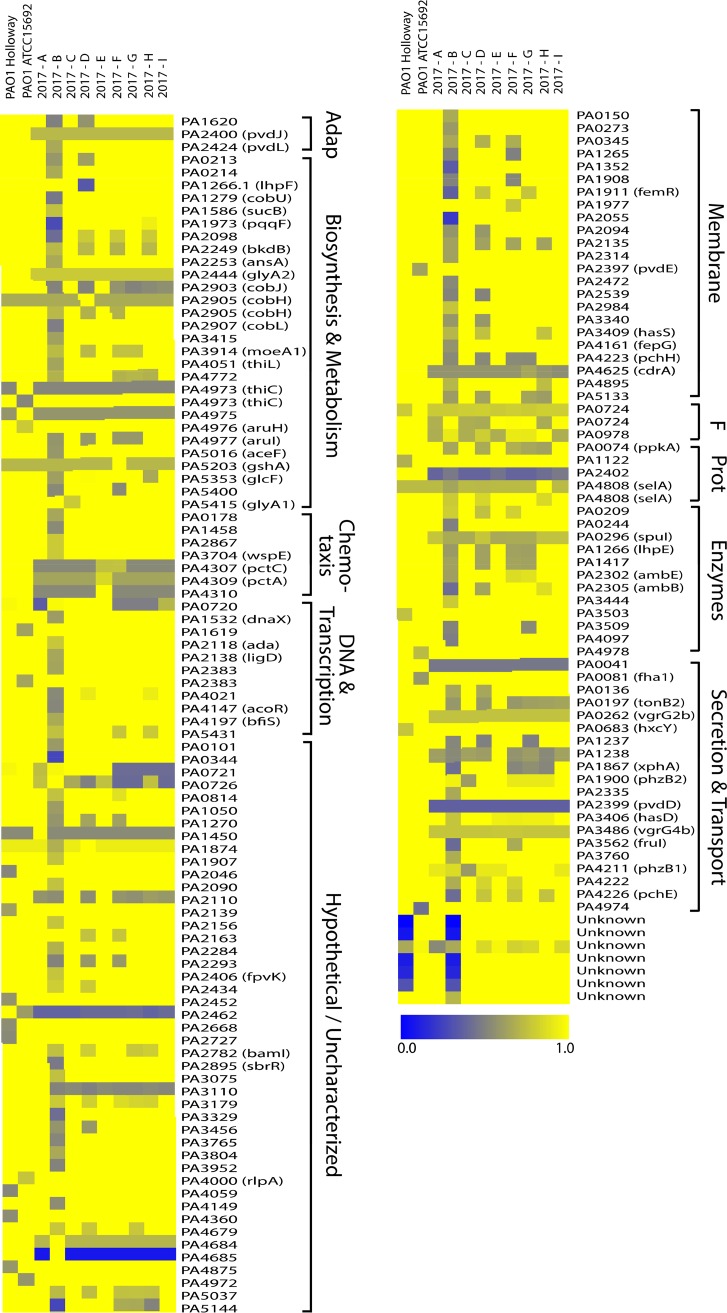
FIG 1.
Unique gene profiles based on large-scale BLAST score ratio (LS-BSR) analysis. All genomes underwent LS-BSR analysis to determine the presence and level of protein sequence identity of gene products. The 164 genes that were not conserved across the genomes are represented here (LS-BSR score, <0.8). Reference protein sequences were taken from the originally sequenced PAO1 strain (GenBank accession number NZ_CP017149.1). Blue represents a lower level of similarity over the length of the queried sequence (full blue indicates 0% identity), and yellow represents a higher level of similarity (full yellow indicates 100% identity). Classifications on the right are loosely based on PseudoCap identifiers. Adap, adaptation; F, foreign (phage, plasmid, transposon); Prot, protein and translation.

