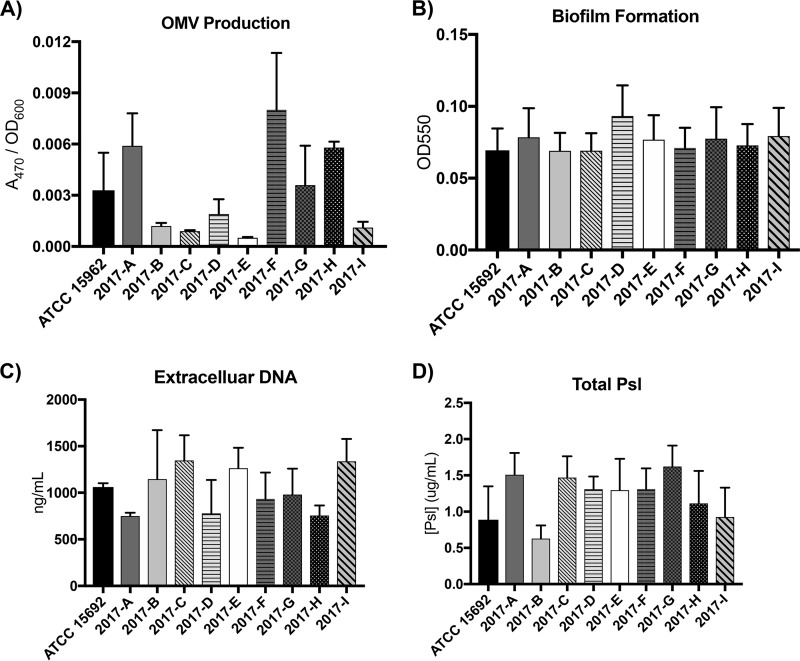
FIG 6.
OMV, eDNA, and Psl production is variable between sublines yet has no effect on biofilm formation. (A) OMV production was assayed and normalized to the cell density (n = 3). (B) Biofilm formation was assayed using a microtiter dish method (n = 6). (C) Extracellular DNA was quantified after extraction from a 5-ml culture (n = 6). Additional extracellular DNA measurements are in Fig. S2 in the supplemental material. (D) Total Psl was quantified as the sum of cell-free and surface-associated Psl (n = 3).

