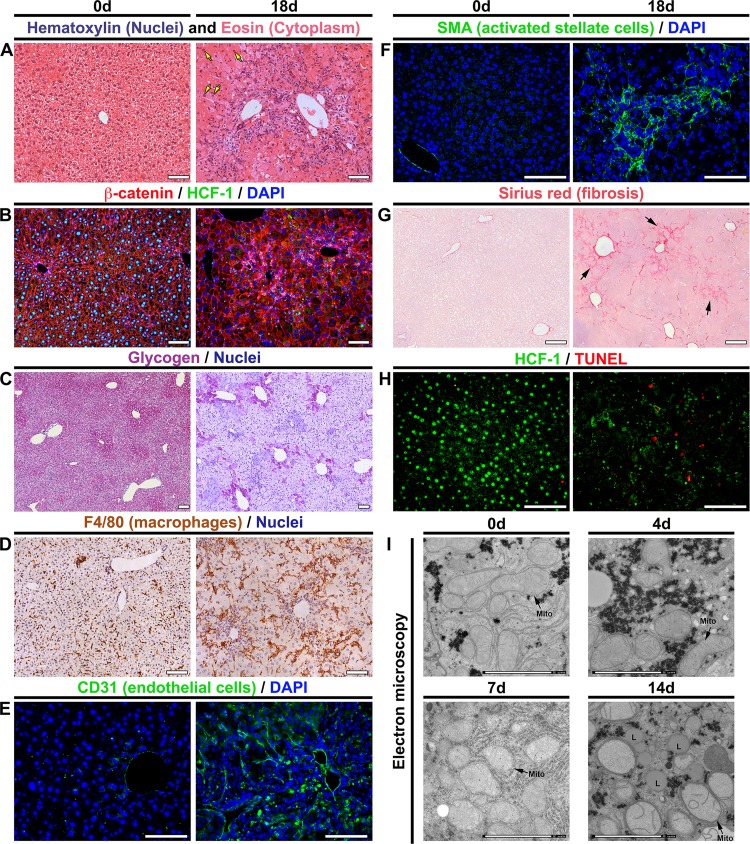
FIG 3.
Hcfc1hepKO/Y males display characteristics typical of NASH by 18 days after tamoxifen treatment. (A to H) Comparison of paraffin-embedded sections (A to D and F to H) and cryosections (E) of control livers (0d; left) and Alb-Cre-ERT2tg; Hcfc1hepKO/Y livers 18 days after tamoxifen treatment (right). (A) Hematoxylin (blue) and eosin (pink) staining. Arrows point to hepatocytes with various nuclear sizes. (B) Sections stained with DAPI (blue) together with β-catenin (red) and HCF-1 (green) antibodies. (C) Hepatic glycogen visualized by PAS staining (purple). The sections were also stained with hematoxylin (blue). (D) DAB immunostaining for macrophage marker F4/80 (brown). The sections were also stained with hematoxylin (blue). (E) Cryosections stained with DAPI (blue) and CD-31 antibody (green). (F) Sections stained with DAPI (blue) and smooth-muscle α-actin (SMA; green) antibody. (G) Sections stained with Sirius red. The arrows point to collagen fibers. (H) TUNEL assay of apoptotic cells (red) costained with HCF-1 antibody (green). TUNEL-positive apoptotic cells are shown in red. (I) Electron microscopic images of control liver (0d) and knockout Alb-Cre-ERT2tg; Hcfc1hepKO/Y male liver samples 4, 7, and 14 days after tamoxifen treatment. Scale bars: 100 μm (A to H) and 2 μm (I).

