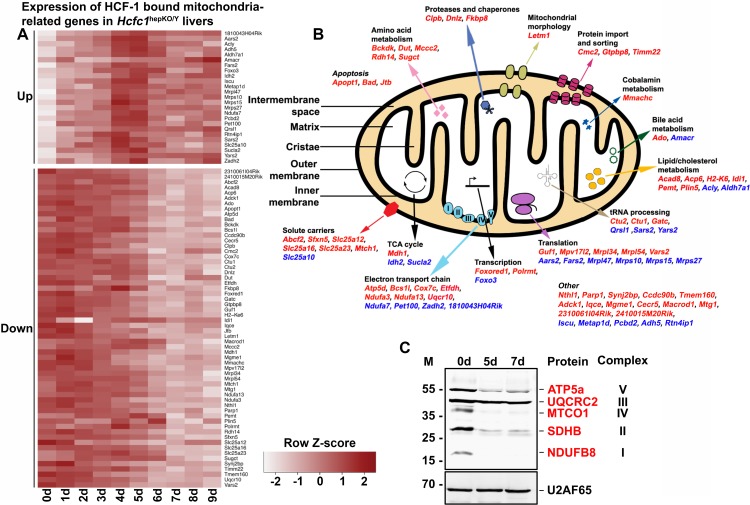
FIG 6.
Combined RNA-Seq and ChIP-Seq analyses of control and Hcfc1hepKO/Y male livers identifies major alterations in expression levels of HCF-1-bound mitochondrion-related genes upon loss of HCF-1. (A) Heat map of upregulated (top) and downregulated (bottom) mitochondrial-cellular component (GO:0005739) gene-specific RNA levels whose corresponding TSS is bound by HCF-1 from 0 to 9 days after tamoxifen treatment in Alb-Cre-ERT2tg; Hcfc1hepKO/Y males. The color key indicates the associated Z-score. (B) Schematic of a mitochondrion showing functionally annotated genes whose TSS is HCF-1 bound and shows either upregulation (blue) or downregulation (red) upon loss of HCF-1. (C) Immunoblotting with anti-OXPHOS antibody cocktail and anti-U2AF65 loading control antibody with liver lysates of samples collected from control (0d) liver, and Alb-Cre-ERT2tg; Hcfc1hepKO/Y male livers 5 and 7 days after tamoxifen treatment.

