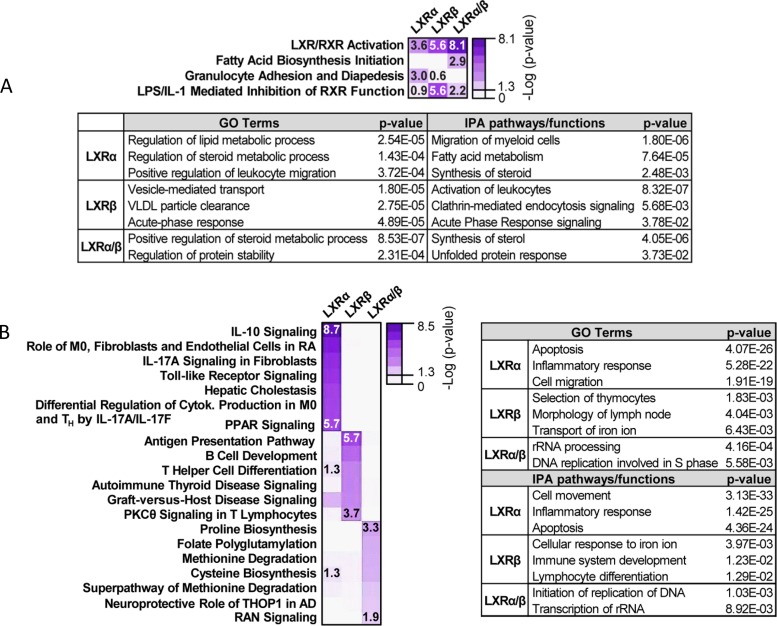
FIG 7.
Gene Ontology analysis and IPA pathway annotation for microarray gene clusters. Biological pathway analysis was performed on genes that belong to pharmacologically responsive (up in GW3965/GW233 ratio, modes I and II) and nonresponsive (up when referred to iBMDM-DKO, mode III) clusters. (A) Most relevant IPA biological pathways associated with modes I and II (pharmacologically responsive) are depicted as a heatmap. Below, additional relevant GO terms and functions identified by IPA are shown. (B) Most relevant IPA biological pathways associated with mode III (pharmacologically nonresponsive) are depicted as a heatmap. Pathways were arranged by receptor dependence. The table on the right shows additional relevant GO terms and IPA functions. Right-tailed Fisher’s exact test P values for each case are shown. The highest, lowest, and borderline statistically significant P values are shown for each category.

