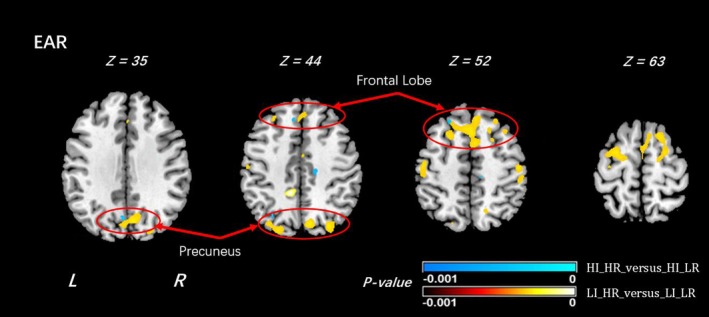
Figure 5.

Difference of EAR results between the comparisons 3 and 4. In the comparison of the EAR results of HI_HR versus HI_LR shown in violet color, and the EAR results of LI_HR versus LI_LR shown in bright yellow and red. All the significance in areas close to precuneus regions disappeared in the results of HI_HR versus HI_LR (circled in red). The sign “‐” used in the p‐value colorbar is to indicate that the values were statistically smaller in the corresponding comparisons
