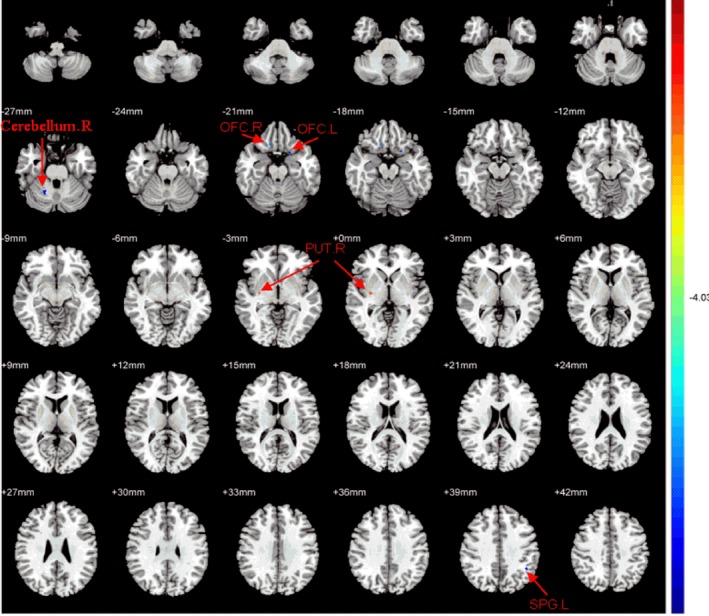
Figure 1.

Regions with significant differences in FA value between OCD patients and NCs. The OCD patients showed decreased FA values in the right orbital frontal cortex, left orbital frontal cortex, right cerebellum, left superior parietal gyrus, higher FA values in the right putamen nucleus white matter. T‐score bars were shown on the right. Red and blue denote higher and lower FA values, respectively (p < 0.001, corrected)
